Page 593 - Probability and Statistical Inference
P. 593

570    13. Sample Size Determination: Two-Stage Procedures

                                    Now, recall that the support for the random variable S  is the whole posi-
                                                                                 n
                                 tive half of the real line, that is S  has a positive density at the point s if and
                                                             n
                                 only if s > 0.
                                          How wide can the customary confidence interval J  be?
                                                                                     n
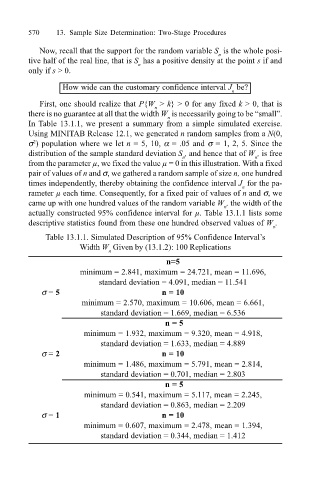
                                    First, one should realize that P{W  > k} > 0 for any fixed k > 0, that is
                                                                 n
                                 there is no guarantee at all that the width W  is necessarily going to be “small”.
                                                                    n
                                 In Table 13.1.1, we present a summary from a simple simulated exercise.
                                 Using MINITAB Release 12.1, we generated n random samples from a N(0,
                                 σ ) population where we let n = 5, 10, α = .05 and σ = 1, 2, 5. Since the
                                  2
                                 distribution of the sample standard deviation S , and hence that of W , is free
                                                                                           n
                                                                        n
                                 from the parameter µ, we fixed the value µ = 0 in this illustration. With a fixed
                                 pair of values of n and σ, we gathered a random sample of size n, one hundred
                                 times independently, thereby obtaining the confidence interval J  for the pa-
                                                                                       n
                                 rameter µ each time. Consequently, for a fixed pair of values of n and σ, we
                                 came up with one hundred values of the random variable W , the width of the
                                                                                   n
                                 actually constructed 95% confidence interval for µ. Table 13.1.1 lists some
                                 descriptive statistics found from these one hundred observed values of W .
                                                                                               n
                                     Table 13.1.1. Simulated Description of 95% Confidence Interval’s
                                              Width W  Given by (13.1.2): 100 Replications
                                                     n
                                                                    n=5
                                              minimum = 2.841, maximum = 24.721, mean = 11.696,
                                                   standard deviation = 4.091, median = 11.541
                                    σ = 5                          n = 10
                                               minimum = 2.570, maximum = 10.606, mean = 6.661,
                                                   standard deviation = 1.669, median = 6.536
                                                                    n = 5
                                               minimum = 1.932, maximum = 9.320, mean = 4.918,
                                                   standard deviation = 1.633, median = 4.889
                                    σ = 2                          n = 10
                                               minimum = 1.486, maximum = 5.791, mean = 2.814,
                                                   standard deviation = 0.701, median = 2.803
                                                                    n = 5
                                               minimum = 0.541, maximum = 5.117, mean = 2.245,
                                                   standard deviation = 0.863, median = 2.209
                                    σ = 1                          n = 10
                                               minimum = 0.607, maximum = 2.478, mean = 1.394,
                                                   standard deviation = 0.344, median = 1.412
   588   589   590   591   592   593   594   595   596   597   598