
Page 651 - Probability and Statistical Inference
P. 651
628 14. Appendix
14.3.3 Percentage Points of the Students t Distribution
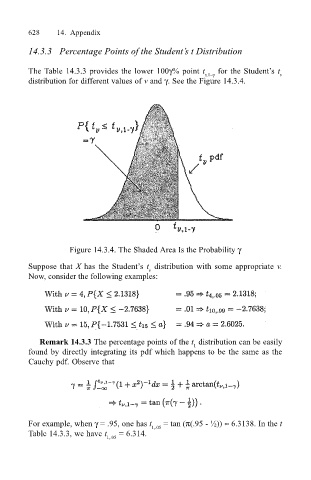
The Table 14.3.3 provides the lower 100γ% point t v,1γ for the Students t v
distribution for different values of v and γ. See the Figure 14.3.4.
Figure 14.3.4. The Shaded Area Is the Probability γ
Suppose that X has the Students t distribution with some appropriate v.
v
Now, consider the following examples:
Remark 14.3.3 The percentage points of the t distribution can be easily
1
found by directly integrating its pdf which happens to be the same as the
Cauchy pdf. Observe that
For example, when γ = .95, one has t 1,.05 = tan (π(.95 - ½)) ≈ 6.3138. In the t
Table 14.3.3, we have t = 6.314.
1,.05