
Page 80 - Probability and Statistical Inference
P. 80
1. Notions of Probability 57
variable X given by
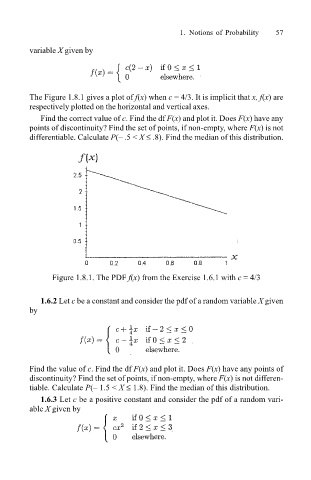
The Figure 1.8.1 gives a plot of f(x) when c = 4/3. It is implicit that x, f(x) are
respectively plotted on the horizontal and vertical axes.
Find the correct value of c. Find the df F(x) and plot it. Does F(x) have any
points of discontinuity? Find the set of points, if non-empty, where F(x) is not
differentiable. Calculate P( .5 < X ≤ .8). Find the median of this distribution.
Figure 1.8.1. The PDF f(x) from the Exercise 1.6.1 with c = 4/3
1.6.2 Let c be a constant and consider the pdf of a random variable X given
by
Find the value of c. Find the df F(x) and plot it. Does F(x) have any points of
discontinuity? Find the set of points, if non-empty, where F(x) is not differen-
tiable. Calculate P( 1.5 < X ≤ 1.8). Find the median of this distribution.
1.6.3 Let c be a positive constant and consider the pdf of a random vari-
able X given by