
Page 194 - Process Equipment and Plant Design Principles and Practices by Subhabrata Ray Gargi Das
P. 194
192 Chapter 6 Evaporators
Enthalpy plots
Evaporator design calculations involve enthalpy balance around the effects that require solution
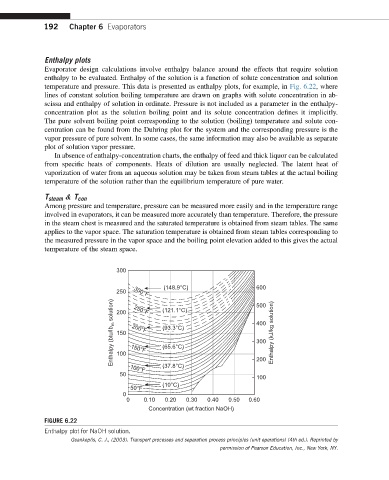
enthalpy to be evaluated. Enthalpy of the solution is a function of solute concentration and solution
temperature and pressure. This data is presented as enthalpy plots, for example, in Fig. 6.22, where
lines of constant solution boiling temperature are drawn on graphs with solute concentration in ab-
scissa and enthalpy of solution in ordinate. Pressure is not included as a parameter in the enthalpy-
concentration plot as the solution boiling point and its solute concentration defines it implicitly.
The pure solvent boiling point corresponding to the solution (boiling) temperature and solute con-
centration can be found from the Duhring plot for the system and the corresponding pressure is the
vapor pressure of pure solvent. In some cases, the same information may also be available as separate
plot of solution vapor pressure.
In absence of enthalpy-concentration charts, the enthalpy of feed and thick liquor can be calculated
from specific heats of components. Heats of dilution are usually neglected. The latent heat of
vaporization of water from an aqueous solution may be taken from steam tables at the actual boiling
temperature of the solution rather than the equilibrium temperature of pure water.
T steam & T con
Among pressure and temperature, pressure can be measured more easily and in the temperature range
involved in evaporators, it can be measured more accurately than temperature. Therefore, the pressure
in the steam chest is measured and the saturated temperature is obtained from steam tables. The same
applies to the vapor space. The saturation temperature is obtained from steam tables corresponding to
the measured pressure in the vapor space and the boiling point elevation added to this gives the actual
temperature of the steam space.
300
(148.9°C) 600
250 300°F (121.1°C) 500
Enthalpy (btu/lb m solution) 200 150°F (93.3°C) 400 Enthalpy (kJ/kg solution)
250°F
200°F
150
300
(65.6°C)
100
100°F (37.8°C) 200
50
100
(10°C)
50°F
0
0 0.10 0.20 0.30 0.40 0.50 0.60
Concentration (wt fraction NaOH)
FIGURE 6.22
Enthalpy plot for NaOH solution.
Geankoplis, C. J., (2003). Transport processes and separation process principles (unit operations) (4th ed.). Reprinted by
permission of Pearson Education, Inc., New York, NY.