
Page 191 - Process Equipment and Plant Design Principles and Practices by Subhabrata Ray Gargi Das
P. 191
6.6 Evaporator design 189
T steam is the heating steam supply temperature and T V refers to the vapor saturation temperature from
th
the last (N ) effect (including BPE).
For a single-effect evaporator of area A, operating at DT ov with a heat transfer coefficient U av
(6.15)
q ¼ U av A DT ov
Thus for constant DT ov , the total capacity of the system remains substantially unchanged by varying
the number of effects while the capital cost increases. Thus a N effect evaporator will cost about N
times a single-effect evaporator. Therefore, the choice of the proper number of effects is dictated by an
economic balance between savings in steam obtained by multiple-effect evaporation and added in-
vestment costs due to addition of each additional effect.
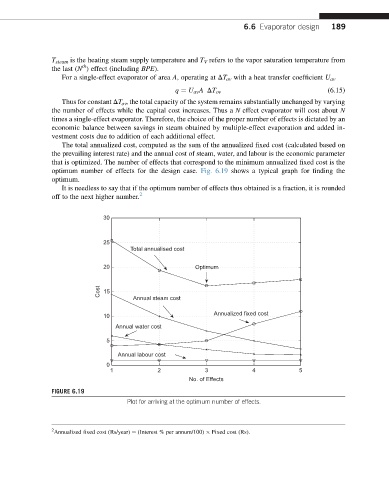
The total annualized cost, computed as the sum of the annualized fixed cost (calculated based on
the prevailing interest rate) and the annual cost of steam, water, and labour is the economic parameter
that is optimized. The number of effects that correspond to the minimum annualized fixed cost is the
optimum number of effects for the design case. Fig. 6.19 shows a typical graph for finding the
optimum.
It is needless to say that if the optimum number of effects thus obtained is a fraction, it is rounded
off to the next higher number. 2
30
25
Total annualised cost
20 Optimum
Cost 15
Annual steam cost
Annualized fixed cost
10
Annual water cost
5
Annual labour cost
0
1 2 3 4 5
No. of Effects
FIGURE 6.19
Plot for arriving at the optimum number of effects.
2
Annualized fixed cost (Rs/year) ¼ (Interest % per annum/100) Fixed cost (Rs).