
Page 203 - Process Equipment and Plant Design Principles and Practices by Subhabrata Ray Gargi Das
P. 203
6.7 Design illustration 201
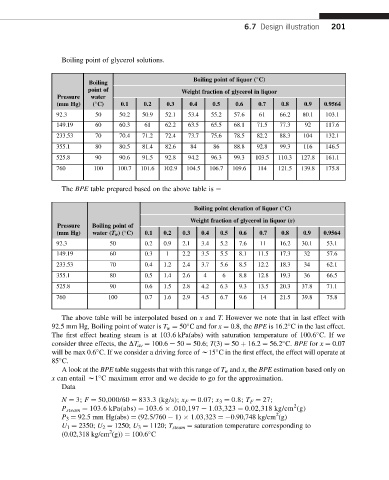
Boiling point of glycerol solutions.
Boiling point of liquor ( C)
Boiling
point of Weight fraction of glycerol in liquor
Pressure water
(mm Hg) ( C) 0.1 0.2 0.3 0.4 0.5 0.6 0.7 0.8 0.9 0.9564
92.3 50 50.2 50.9 52.1 53.4 55.2 57.6 61 66.2 80.1 103.1
149.19 60 60.3 61 62.2 63.5 65.5 68.1 71.5 77.3 92 117.6
233.53 70 70.4 71.2 72.4 73.7 75.6 78.5 82.2 88.3 104 132.1
355.1 80 80.5 81.4 82.6 84 86 88.8 92.8 99.3 116 146.5
525.8 90 90.6 91.5 92.8 94.2 96.3 99.3 103.5 110.3 127.8 161.1
760 100 100.7 101.6 102.9 104.5 106.7 109.6 114 121.5 139.8 175.8
The BPE table prepared based on the above table is e
Boiling point elevation of liquor ( C)
Weight fraction of glycerol in liquor (x)
Pressure Boiling point of
(mm Hg) water (T w )( C) 0.1 0.2 0.3 0.4 0.5 0.6 0.7 0.8 0.9 0.9564
92.3 50 0.2 0.9 2.1 3.4 5.2 7.6 11 16.2 30.1 53.1
149.19 60 0.3 1 2.2 3.5 5.5 8.1 11.5 17.3 32 57.6
233.53 70 0.4 1.2 2.4 3.7 5.6 8.5 12.2 18.3 34 62.1
355.1 80 0.5 1.4 2.6 4 6 8.8 12.8 19.3 36 66.5
525.8 90 0.6 1.5 2.8 4.2 6.3 9.3 13.5 20.3 37.8 71.1
760 100 0.7 1.6 2.9 4.5 6.7 9.6 14 21.5 39.8 75.8
The above table will be interpolated based on x and T. However we note that in last effect with
92.5 mm Hg, Boiling point of water is T w ¼ 50 C and for x ¼ 0.8, the BPE is 16.2 C in the last effect.
The first effect heating steam is at 103.6 kPa(abs) with saturation temperature of 100.6 C. If we
consider three effects, the DT av ¼ 100.6 e 50 ¼ 50.6; T(3) ¼ 50 þ 16.2 ¼ 56.2 C. BPE for x ¼ 0.07
will be max 0.6 C. If we consider a driving force of w15 C in the first effect, the effect will operate at
85 C.
A look at the BPE table suggests that with this range of T w and x, the BPE estimation based only on
x can entail w1 C maximum error and we decide to go for the approximation.
Data
N ¼ 3; F ¼ 50,000/60 ¼ 833.3 (kg/s); x F ¼ 0.07; x 3 ¼ 0.8; T F ¼ 27;
2
P steam ¼ 103.6 kPa(abs) ¼ 103.6 .010,197 e 1.03,323 ¼ 0.02,318 kg/cm (g)
2
P 3 ¼ 92.5 mm Hg(abs) ¼ (92.5/760 e 1) 1.03,323 ¼ 0.90,748 kg/cm (g)
U 1 ¼ 2350; U 2 ¼ 1250; U 3 ¼ 1120; T steam ¼ saturation temperature corresponding to
2
(0.02,318 kg/cm (g)) ¼ 100.6 C