
Page 250 -
P. 250
232 8 Mining Additional Perspectives
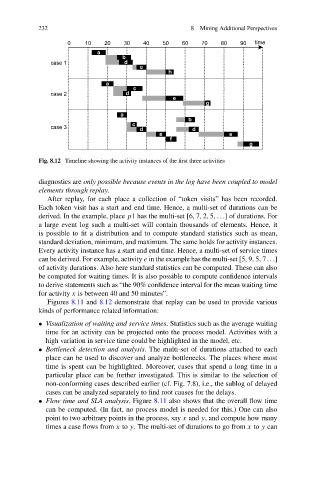
Fig. 8.12 Timeline showing the activity instances of the first three activities
diagnostics are only possible because events in the log have been coupled to model
elements through replay.
After replay, for each place a collection of “token visits” has been recorded.
Each token visit has a start and end time. Hence, a multi-set of durations can be
derived. In the example, place p1 has the multi-set [6,7,2,5,...] of durations. For
a large event log such a multi-set will contain thousands of elements. Hence, it
is possible to fit a distribution and to compute standard statistics such as mean,
standard deviation, minimum, and maximum. The same holds for activity instances.
Every activity instance has a start and end time. Hence, a multi-set of service times
can be derived. For example, activity e in the example has the multi-set [5,9,5,7...]
of activity durations. Also here standard statistics can be computed. These can also
be computed for waiting times. It is also possible to compute confidence intervals
to derive statements such as “the 90% confidence interval for the mean waiting time
for activity x is between 40 and 50 minutes”.
Figures 8.11 and 8.12 demonstrate that replay can be used to provide various
kinds of performance related information:
• Visualization of waiting and service times. Statistics such as the average waiting
time for an activity can be projected onto the process model. Activities with a
high variation in service time could be highlighted in the model, etc.
• Bottleneck detection and analysis. The multi-set of durations attached to each
place can be used to discover and analyze bottlenecks. The places where most
time is spent can be highlighted. Moreover, cases that spend a long time in a
particular place can be further investigated. This is similar to the selection of
non-conforming cases described earlier (cf. Fig. 7.8), i.e., the sublog of delayed
cases can be analyzed separately to find root causes for the delays.
• Flow time and SLA analysis. Figure 8.11 also shows that the overall flow time
can be computed. (In fact, no process model is needed for this.) One can also
point to two arbitrary points in the process, say x and y, and compute how many
times a case flows from x to y. The multi-set of durations to go from x to y can