
Page 246 -
P. 246
228 8 Mining Additional Perspectives
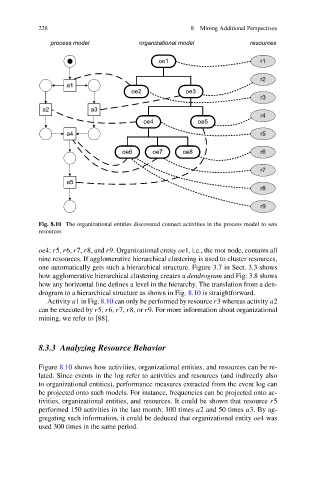
Fig. 8.10 The organizational entities discovered connect activities in the process model to sets
resources
oe4: r5, r6, r7, r8, and r9. Organizational entity oe1, i.e., the root node, contains all
nine resources. If agglomerative hierarchical clustering is used to cluster resources,
one automatically gets such a hierarchical structure. Figure 3.7 in Sect. 3.3 shows
how agglomerative hierarchical clustering creates a dendrogram and Fig. 3.8 shows
how any horizontal line defines a level in the hierarchy. The translation from a den-
drogram to a hierarchical structure as shown in Fig. 8.10 is straightforward.
Activity a1in Fig. 8.10 can only be performed by resource r3 whereas activity a2
can be executed by r5, r6, r7, r8, or r9. For more information about organizational
mining, we refer to [88].
8.3.3 Analyzing Resource Behavior
Figure 8.10 shows how activities, organizational entities, and resources can be re-
lated. Since events in the log refer to activities and resources (and indirectly also
to organizational entities), performance measures extracted from the event log can
be projected onto such models. For instance, frequencies can be projected onto ac-
tivities, organizational entities, and resources. It could be shown that resource r5
performed 150 activities in the last month: 100 times a2 and 50 times a3. By ag-
gregating such information, it could be deduced that organizational entity oe4was
used 300 times in the same period.