
Page 242 -
P. 242
224 8 Mining Additional Perspectives
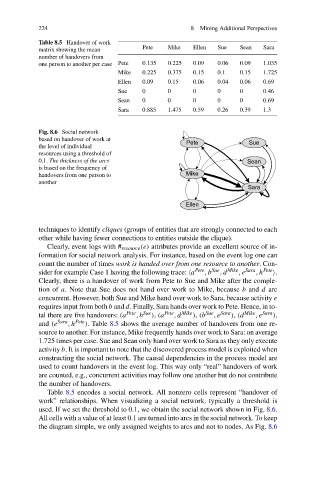
Table 8.5 Handover of work
matrix showing the mean Pete Mike Ellen Sue Sean Sara
number of handovers from
one person to another per case Pete 0.135 0.225 0.09 0.06 0.09 1.035
Mike 0.225 0.375 0.15 0.1 0.15 1.725
Ellen 0.09 0.15 0.06 0.04 0.06 0.69
Sue 0 0 0 0 0 0.46
Sean 0 0 0 0 0 0.69
Sara 0.885 1.475 0.59 0.26 0.39 1.3
Fig. 8.6 Social network
based on handover of work at
the level of individual
resources using a threshold of
0.1. The thickness of the arcs
is based on the frequency of
handovers from one person to
another
techniques to identify cliques (groups of entities that are strongly connected to each
other while having fewer connections to entities outside the clique).
Clearly, event logs with # resource (e) attributes provide an excellent source of in-
formation for social network analysis. For instance, based on the event log one can
count the number of times work is handed over from one resource to another. Con-
sider for example Case 1 having the following trace: a Pete ,b Sue ,d Mike ,e Sara ,h Pete .
Clearly, there is a handover of work from Pete to Sue and Mike after the comple-
tion of a. Note that Sue does not hand over work to Mike, because b and d are
concurrent. However, both Sue and Mike hand over work to Sara, because activity e
requires input from both b and d. Finally, Sara hands over work to Pete. Hence, in to-
tal there are five handovers: (a Pete ,b Sue ), (a Pete ,d Mike ), (b Sue ,e Sara ), (d Mike ,e Sara ),
and (e Sara ,h Pete ). Table 8.5 shows the average number of handovers from one re-
source to another. For instance, Mike frequently hands over work to Sara: on average
1.725 times per case. Sue and Sean only hand over work to Sara as they only execute
activity b. It is important to note that the discovered process model is exploited when
constructing the social network. The causal dependencies in the process model are
used to count handovers in the event log. This way only “real” handovers of work
are counted, e.g., concurrent activities may follow one another but do not contribute
the number of handovers.
Table 8.5 encodes a social network. All nonzero cells represent “handover of
work” relationships. When visualizing a social network, typically a threshold is
used. If we set the threshold to 0.1, we obtain the social network shown in Fig. 8.6.
All cells with a value of at least 0.1 are turned into arcs in the social network. To keep
the diagram simple, we only assigned weights to arcs and not to nodes. As Fig. 8.6