
Page 243 -
P. 243
8.3 Organizational Mining 225
Table 8.6 Handover of work
matrix at the role level Assistant Expert Manager
Assistant 1.5 0.5 3.45
Expert 0 0 1.15
Manager 2.95 0.65 1.3
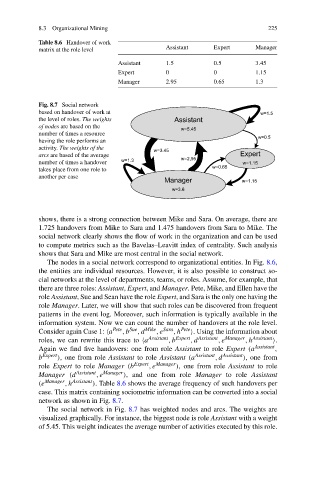
Fig. 8.7 Social network
based on handover of work at
the level of roles. The weights
of nodes are based on the
number of times a resource
having the role performs an
activity. The weights of the
arcs are based of the average
number of times a handover
takes place from one role to
another per case
shows, there is a strong connection between Mike and Sara. On average, there are
1.725 handovers from Mike to Sara and 1.475 handovers from Sara to Mike. The
social network clearly shows the flow of work in the organization and can be used
to compute metrics such as the Bavelas–Leavitt index of centrality. Such analysis
shows that Sara and Mike are most central in the social network.
The nodes in a social network correspond to organizational entities. In Fig. 8.6,
the entities are individual resources. However, it is also possible to construct so-
cial networks at the level of departments, teams, or roles. Assume, for example, that
there are three roles: Assistant, Expert, and Manager. Pete, Mike, and Ellen have the
role Assistant, Sue and Sean have the role Expert, and Sara is the only one having the
role Manager. Later, we will show that such roles can be discovered from frequent
patterns in the event log. Moreover, such information is typically available in the
information system. Now we can count the number of handovers at the role level.
Consider again Case 1: a Pete ,b Sue ,d Mike ,e Sara ,h Pete . Using the information about
roles, we can rewrite this trace to a Assistant ,b Expert ,d Assistant ,e Manager ,h Assistant .
Again we find five handovers: one from role Assistant to role Expert (a Assistant ,
b Expert ), one from role Assistant to role Assistant (a Assistant ,d Assistant ), one from
role Expert to role Manager (b Expert ,e Manager ), one from role Assistant to role
Manager (d Assistant ,e Manager ), and one from role Manager to role Assistant
(e Manager ,h Assistant ). Table 8.6 shows the average frequency of such handovers per
case. This matrix containing sociometric information can be converted into a social
network as shown in Fig. 8.7.
The social network in Fig. 8.7 has weighted nodes and arcs. The weights are
visualized graphically. For instance, the biggest node is role Assistant with a weight
of 5.45. This weight indicates the average number of activities executed by this role.