
Page 239 -
P. 239
8.3 Organizational Mining 221
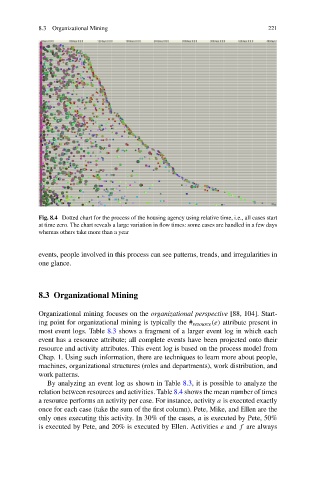
Fig. 8.4 Dotted chart for the process of the housing agency using relative time, i.e., all cases start
at time zero. The chart reveals a large variation in flow times: some cases are handled in a few days
whereas others take more than a year
events, people involved in this process can see patterns, trends, and irregularities in
one glance.
8.3 Organizational Mining
Organizational mining focuses on the organizational perspective [88, 104]. Start-
ing point for organizational mining is typically the # resource (e) attribute present in
most event logs. Table 8.3 shows a fragment of a larger event log in which each
event has a resource attribute; all complete events have been projected onto their
resource and activity attributes. This event log is based on the process model from
Chap. 1. Using such information, there are techniques to learn more about people,
machines, organizational structures (roles and departments), work distribution, and
work patterns.
By analyzing an event log as shown in Table 8.3, it is possible to analyze the
relation between resources and activities. Table 8.4 shows the mean number of times
a resource performs an activity per case. For instance, activity a is executed exactly
once for each case (take the sum of the first column). Pete, Mike, and Ellen are the
only ones executing this activity. In 30% of the cases, a is executed by Pete, 50%
is executed by Pete, and 20% is executed by Ellen. Activities e and f are always