
Page 236 -
P. 236
218 8 Mining Additional Perspectives
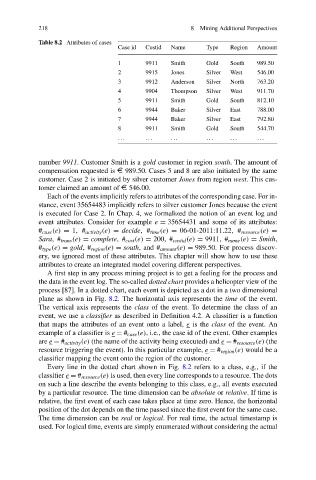
Table 8.2 Attributes of cases
Case id Custid Name Type Region Amount
1 9911 Smith Gold South 989.50
2 9915 Jones Silver West 546.00
3 9912 Anderson Silver North 763.20
4 9904 Thompson Silver West 911.70
5 9911 Smith Gold South 812.10
6 9944 Baker Silver East 788.00
7 9944 Baker Silver East 792.80
8 9911 Smith Gold South 544.70
... ... ... ... ... ...
number 9911. Customer Smith is a gold customer in region south. The amount of
compensation requested is € 989.50. Cases 5 and 8 are also initiated by the same
customer. Case 2 is initiated by silver customer Jones from region west. This cus-
tomer claimed an amount of € 546.00.
Each of the events implicitly refers to attributes of the corresponding case. For in-
stance, event 35654483 implicitly refers to silver customer Jones because the event
is executed for Case 2. In Chap. 4, we formalized the notion of an event log and
event attributes. Consider for example e = 35654431 and some of its attributes:
# case (e) = 1, # activity (e) = decide,# time (e) = 06-01-2011:11.22, # resource (e) =
Sara,# trans (e) = complete,# cost (e) = 200, # custid (e) = 9911, # name (e) = Smith,
# type (e) = gold,# region (e) = south, and # amount (e) = 989.50. For process discov-
ery, we ignored most of these attributes. This chapter will show how to use these
attributes to create an integrated model covering different perspectives.
A first step in any process mining project is to get a feeling for the process and
the data in the event log. The so-called dotted chart provides a helicopter view of the
process [87]. In a dotted chart, each event is depicted as a dot in a two dimensional
plane as shown in Fig. 8.2. The horizontal axis represents the time of the event.
The vertical axis represents the class of the event. To determine the class of an
event, we use a classifier as described in Definition 4.2. A classifier is a function
that maps the attributes of an event onto a label, e is the class of the event. An
example of a classifier is e = # case (e), i.e., the case id of the event. Other examples
are e = # activity (e) (the name of the activity being executed) and e = # resource (e) (the
resource triggering the event). In this particular example, e = # region (e) would be a
classifier mapping the event onto the region of the customer.
Every line in the dotted chart shown in Fig. 8.2 refers to a class, e.g., if the
classifier e = # resource (e) is used, then every line corresponds to a resource. The dots
on such a line describe the events belonging to this class, e.g., all events executed
by a particular resource. The time dimension can be absolute or relative. If time is
relative, the first event of each case takes place at time zero. Hence, the horizontal
position of the dot depends on the time passed since the first event for the same case.
The time dimension can be real or logical. For real time, the actual timestamp is
used. For logical time, events are simply enumerated without considering the actual