
Page 240 -
P. 240
222 8 Mining Additional Perspectives
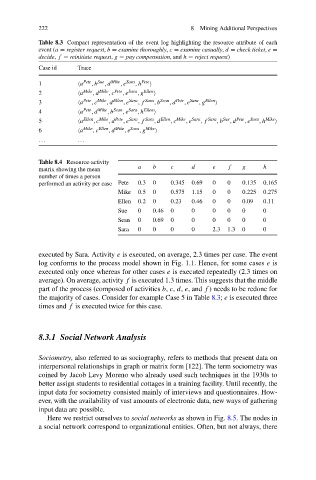
Table 8.3 Compact representation of the event log highlighting the resource attribute of each
event (a = register request, b = examine thoroughly, c = examine casually, d = check ticket, e =
decide, f = reinitiate request, g = pay compensation,and h = reject request)
Case id Trace
1 a Pete ,b Sue ,d Mike ,e Sara ,h Pete
2 a Mike ,d Mike ,c Pete ,e Sara ,g Ellen
3 a Pete ,c Mike ,d Ellen ,e Sara ,f Sara ,b Sean ,d Pete ,e Sara ,g Ellen
4 a Pete ,d Mike ,b Sean ,e Sara ,h Ellen
5 a Ellen ,c Mike ,d Pete ,e Sara ,f Sara ,d Ellen ,c Mike ,e Sara ,f Sara ,b Sue ,d Pete ,e Sara ,h Mike
6 a Mike ,c Ellen ,d Mike ,e Sara ,g Mike
... ...
Table 8.4 Resource-activity
matrix showing the mean a b c d e f g h
number of times a person
performed an activity per case Pete 0.3 0 0.345 0.69 0 0 0.135 0.165
Mike 0.5 0 0.575 1.15 0 0 0.225 0.275
Ellen 0.2 0 0.23 0.46 0 0 0.09 0.11
Sue 0 0.46 0 0 0 0 0 0
Sean 0 0.69 0 0 0 0 0 0
Sara 0 0 0 0 2.3 1.3 0 0
executed by Sara. Activity e is executed, on average, 2.3 times per case. The event
log conforms to the process model shown in Fig. 1.1. Hence, for some cases e is
executed only once whereas for other cases e is executed repeatedly (2.3 times on
average). On average, activity f is executed 1.3 times. This suggests that the middle
part of the process (composed of activities b, c, d, e, and f ) needs to be redone for
the majority of cases. Consider for example Case 5 in Table 8.3; e is executed three
times and f is executed twice for this case.
8.3.1 Social Network Analysis
Sociometry, also referred to as sociography, refers to methods that present data on
interpersonal relationships in graph or matrix form [122]. The term sociometry was
coined by Jacob Levy Moreno who already used such techniques in the 1930s to
better assign students to residential cottages in a training facility. Until recently, the
input data for sociometry consisted mainly of interviews and questionnaires. How-
ever, with the availability of vast amounts of electronic data, new ways of gathering
input data are possible.
Here we restrict ourselves to social networks as shown in Fig. 8.5. The nodes in
a social network correspond to organizational entities. Often, but not always, there