
Page 251 -
P. 251
8.4 Time and Probabilities 233
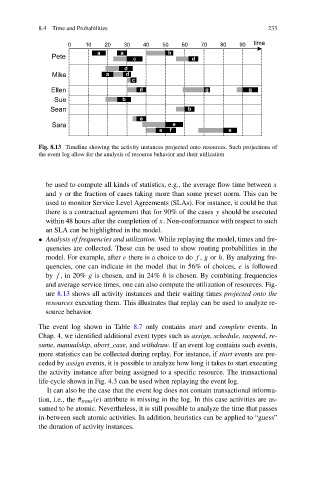
Fig. 8.13 Timeline showing the activity instances projected onto resources. Such projections of
the event log allow for the analysis of resource behavior and their utilization
be used to compute all kinds of statistics, e.g., the average flow time between x
and y or the fraction of cases taking more than some preset norm. This can be
used to monitor Service Level Agreements (SLAs). For instance, it could be that
there is a contractual agreement that for 90% of the cases y should be executed
within 48 hours after the completion of x. Non-conformance with respect to such
an SLA can be highlighted in the model.
• Analysis of frequencies and utilization. While replaying the model, times and fre-
quencies are collected. These can be used to show routing probabilities in the
model. For example, after e there is a choice to do f , g or h. By analyzing fre-
quencies, one can indicate in the model that in 56% of choices, e is followed
by f , in 20% g is chosen, and in 24% h is chosen. By combining frequencies
and average service times, one can also compute the utilization of resources. Fig-
ure 8.13 shows all activity instances and their waiting times projected onto the
resources executing them. This illustrates that replay can be used to analyze re-
source behavior.
The event log shown in Table 8.7 only contains start and complete events. In
Chap. 4, we identified additional event types such as assign, schedule, suspend, re-
sume, manualskip, abort_case, and withdraw. If an event log contains such events,
more statistics can be collected during replay. For instance, if start events are pre-
ceded by assign events, it is possible to analyze how long it takes to start executing
the activity instance after being assigned to a specific resource. The transactional
life-cycle shown in Fig. 4.3 can be used when replaying the event log.
It can also be the case that the event log does not contain transactional informa-
tion, i.e., the # trans (e) attribute is missing in the log. In this case activities are as-
sumed to be atomic. Nevertheless, it is still possible to analyze the time that passes
in-between such atomic activities. In addition, heuristics can be applied to “guess”
the duration of activity instances.