
Page 290 -
P. 290
272 10 Tool Support
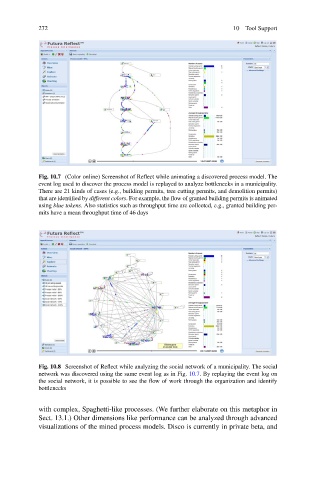
Fig. 10.7 (Color online) Screenshot of Reflect while animating a discovered process model. The
event log used to discover the process model is replayed to analyze bottlenecks in a municipality.
There are 21 kinds of cases (e.g., building permits, tree cutting permits, and demolition permits)
that are identified by different colors. For example, the flow of granted building permits is animated
using blue tokens. Also statistics such as throughput time are collected, e.g., granted building per-
mits have a mean throughput time of 46 days
Fig. 10.8 Screenshot of Reflect while analyzing the social network of a municipality. The social
network was discovered using the same event log as in Fig. 10.7. By replaying the event log on
the social network, it is possible to see the flow of work through the organization and identify
bottlenecks
with complex, Spaghetti-like processes. (We further elaborate on this metaphor in
Sect. 13.1.) Other dimensions like performance can be analyzed through advanced
visualizations of the mined process models. Disco is currently in private beta, and