
Page 296 -
P. 296
278 11 Analyzing “Lasagna Processes”
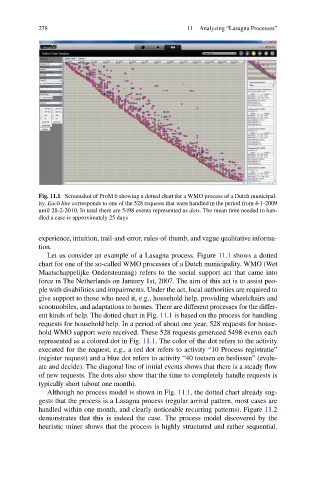
Fig. 11.1 Screenshot of ProM 6 showing a dotted chart for a WMO process of a Dutch municipal-
ity. Each line corresponds to one of the 528 requests that were handled in the period from 4-1-2009
until 28-2-2010. In total there are 5498 events represented as dots. The mean time needed to han-
dled a case is approximately 25 days
experience, intuition, trail-and-error, rules-of-thumb, and vague qualitative informa-
tion.
Let us consider an example of a Lasagna process. Figure 11.1 shows a dotted
chart for one of the so-called WMO processes of a Dutch municipality. WMO (Wet
Maatschappelijke Ondersteuning) refers to the social support act that came into
force in The Netherlands on January 1st, 2007. The aim of this act is to assist peo-
ple with disabilities and impairments. Under the act, local authorities are required to
give support to those who need it, e.g., household help, providing wheelchairs and
scootmobiles, and adaptations to homes. There are different processes for the differ-
ent kinds of help. The dotted chart in Fig. 11.1 is based on the process for handling
requests for household help. In a period of about one year, 528 requests for house-
hold WMO support were received. These 528 requests generated 5498 events each
represented as a colored dot in Fig. 11.1. The color of the dot refers to the activity
executed for the request, e.g., a red dot refers to activity “10 Process registratie”
(register request) and a blue dot refers to activity “40 toetsen en beslissen” (evalu-
ate and decide). The diagonal line of initial events shows that there is a steady flow
of new requests. The dots also show that the time to completely handle requests is
typically short (about one month).
Although no process model is shown in Fig. 11.1, the dotted chart already sug-
gests that the process is a Lasagna process (regular arrival pattern, most cases are
handled within one month, and clearly noticeable recurring patterns). Figure 11.2
demonstrates that this is indeed the case. The process model discovered by the
heuristic miner shows that the process is highly structured and rather sequential.