
Page 298 -
P. 298
280 11 Analyzing “Lasagna Processes”
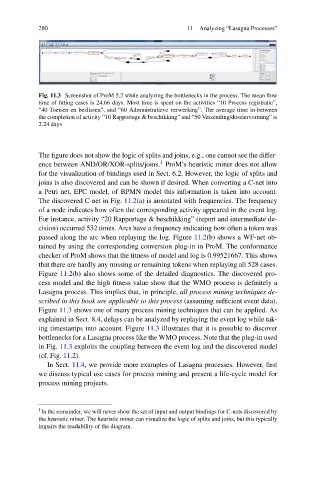
Fig. 11.3 Screenshot of ProM 5.2 while analyzing the bottlenecks in the process. The mean flow
time of fitting cases is 24.66 days. Most time is spent on the activities “10 Process registratie”,
“40 Toetsen en beslissen”, and “60 Administratieve verwerking”. The average time in-between
the completion of activity “10 Rapportage & beschikking” and “50 Verzending/dossiervorming” is
2.24 days
The figure does not show the logic of splits and joins, e.g., one cannot see the differ-
1
ence between AND/OR/XOR-splits/joins. ProM’s heuristic miner does not allow
for the visualization of bindings used in Sect. 6.2. However, the logic of splits and
joins is also discovered and can be shown if desired. When converting a C-net into
a Petri net, EPC model, of BPMN model this information is taken into account.
The discovered C-net in Fig. 11.2(a) is annotated with frequencies. The frequency
of a node indicates how often the corresponding activity appeared in the event log.
For instance, activity “20 Rapportage & beschikking” (report and intermediate de-
cision) occurred 532 times. Arcs have a frequency indicating how often a token was
passed along the arc when replaying the log. Figure 11.2(b) shows a WF-net ob-
tained by using the corresponding conversion plug-in in ProM. The conformance
checker of ProM shows that the fitness of model and log is 0.99521667. This shows
that there are hardly any missing or remaining tokens when replaying all 528 cases.
Figure 11.2(b) also shows some of the detailed diagnostics. The discovered pro-
cess model and the high fitness value show that the WMO process is definitely a
Lasagna process. This implies that, in principle, all process mining techniques de-
scribed in this book are applicable to this process (assuming sufficient event data).
Figure 11.3 shows one of many process mining techniques that can be applied. As
explained in Sect. 8.4, delays can be analyzed by replaying the event log while tak-
ing timestamps into account. Figure 11.3 illustrates that it is possible to discover
bottlenecks for a Lasagna process like the WMO process. Note that the plug-in used
in Fig. 11.3 exploits the coupling between the event log and the discovered model
(cf. Fig. 11.2).
In Sect. 11.4, we provide more examples of Lasagna processes. However, first
we discuss typical use cases for process mining and present a life-cycle model for
process mining projects.
1 In the remainder, we will never show the set of input and output bindings for C-nets discovered by
the heuristic miner. The heuristic miner can visualize the logic of splits and joins, but this typically
impairs the readability of the diagram.