
Page 321 -
P. 321
12.1 Characterization of “Spaghetti Processes” 303
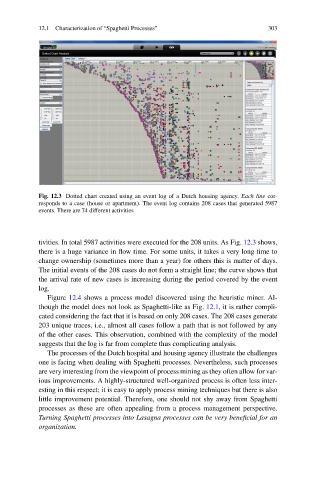
Fig. 12.3 Dotted chart created using an event log of a Dutch housing agency. Each line cor-
responds to a case (house or apartment). The event log contains 208 cases that generated 5987
events. There are 74 different activities
tivities. In total 5987 activities were executed for the 208 units. As Fig. 12.3 shows,
there is a huge variance in flow time. For some units, it takes a very long time to
change ownership (sometimes more than a year) for others this is matter of days.
The initial events of the 208 cases do not form a straight line; the curve shows that
the arrival rate of new cases is increasing during the period covered by the event
log.
Figure 12.4 shows a process model discovered using the heuristic miner. Al-
though the model does not look as Spaghetti-like as Fig. 12.1, it is rather compli-
cated considering the fact that it is based on only 208 cases. The 208 cases generate
203 unique traces, i.e., almost all cases follow a path that is not followed by any
of the other cases. This observation, combined with the complexity of the model
suggests that the log is far from complete thus complicating analysis.
The processes of the Dutch hospital and housing agency illustrate the challenges
one is facing when dealing with Spaghetti processes. Nevertheless, such processes
are very interesting from the viewpoint of process mining as they often allow for var-
ious improvements. A highly-structured well-organized process is often less inter-
esting in this respect; it is easy to apply process mining techniques but there is also
little improvement potential. Therefore, one should not shy away from Spaghetti
processes as these are often appealing from a process management perspective.
Turning Spaghetti processes into Lasagna processes can be very beneficial for an
organization.