Page 147 - Process simulation and control using Aspen
P. 147

ASPEN PLUS   SIMULATION OF DISTILLATION MODELS        135

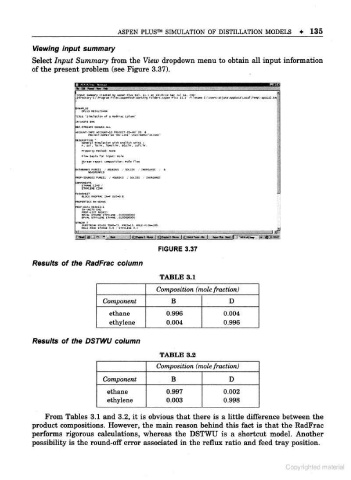
          Viewing input summary
          Select Input Summary from the View dropdown menu to obtain all input information
          of the present problem (see Figure 3.37).


                       ire«.i uiu-y itHin bv up*- »lia  .>. It.I « ll.'S'l* Sal ).i 11,  00'
                       Olr.ciory I  Pro m (tin  -Oin! .s't-t .ic.r Hut II. 1
                       Tin* 'SII»l1»T*("i .*  UlM'M ts'w*
                       I -IIUVI CVfllD ILL
                       .ccolvi.ii>o xcow-io  .Mie'-io-un 10  t
                        cavit 'i-.  ill-  - '- i-.'iM' ..  :,  ;
                        a. B»«. fV*r> ll-al Kr. Hh.Vt , c H.O,
                           Ml> 'w live ">!.
                           'nrari (oiMitilax: Mil flo"
                       Miiauas main  unimi  yxio-  ikkmiu  4

                        tiHu« ei-» -
                        rmkM C!"

                       W'OITl Ultll'l
                        HWii ill wii:i
                           CfWuM EIMK .oio»Xo<»:
                        MCKMI VMB VMIK fi "IWl, ««ll "iw-.'OC.
                       1                                                      ...

                                              FIGURE 3.37
          Results of the RadFrac column

                                               TABLE 3.1
                                             Composition (mole fraction)
                              Component           B               D
                                ethane          0 .996           0 .004
                                ethylene         0 004           0 99G
                                                                  .
                                                  .
          Results of the DSTWU column

                                               TABLE 3.2
                                             Composition (mole fraction)
                              Component           B               D
                               ethane           0 . 997          0 . 002
                               ethylene         0 .003           0 .998

              From Tables 3.1 and 3.2, it is obvious that there is a little difference between the
          product compositions. However, the main reason behind this fact is that the RadFrac
          performs rigorous calculations, whereas the DSTWU is a shortcut model. Another
          possibility is the round-off error associated in the reflux ratio and feed tray position.


                                                                                  Copyrighled malarial
   142   143   144   145   146   147   148   149   150   151   152