
Page 41 - Process simulation and control using Aspen
P. 41
34 PROCESS SIMULATION AND CONTROL USING ASPE N
Running the simulation
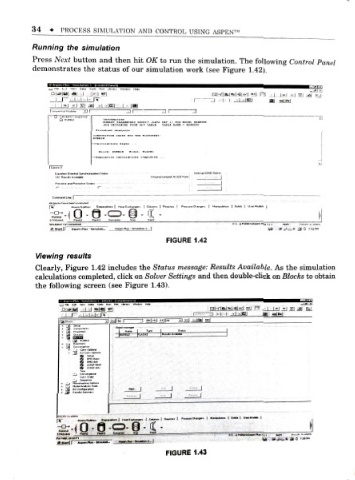
Press Next button and then hit OK to run the simulation . The following Control Panel
demonstrates the status of our simulation work (see Figure 1 .42).
laillUJLIIIlllBIl
i f** t-t Vwi- Data Toofi Bun Lfciafy WVidwv/ Meto
f
JDlugB] atij J-j ral-rlatl-l-qi l «ii [=5 _ d . IjjJ -J SI afl e-i
f
i 3 - i i -i tim mi
4 -1 I "I JiJ S i l <| jjB] | IMI
ss 3 r i r
Inieriijpi DMO Sotver
J . NoEOFwm j
i - r-. - and Po:iiotve SckXi
Command Lr* f "
| Sepaislota | Heat ExchM oeic [ Cohjnmi | Rrac'txt | Prectuie Changed SoMt j Uiei Model: |
o o e - it -
STREAMS ' flathZ Flail-.3 Decade. Sep Sepg
C:\...oFoW«"\A«>enPtuj 1
r ' «* (W Oi/c &<$ 7:52 P
f
FIGURE 1.42
Viewing results
Clearly, Figure 1.42 includes the Status message: Results Available. As the simulation
calculations completed, click on Solver Settings and then double-chck on Blocks to obtain
the following screen (see Figure 1.43).
-
- | ne c >' v«v. 0*a Toob Ain PM Lferarv Wmdcw Hcto
"
J _ l l-l-PT
- j j b I 3 ±tti iiJfXi 32>J jaal n i
33 Set-*
2
O Setup
I
i SOU. | U-Moa* |
<o 9 e i
- CM
1 n .A? FWi3 Dac«4«> Sap
-
| ,Md«fl« .»-.. .
FIGURE 1.43