
Page 69 - Process simulation and control using Aspen
P. 69
62 PROCESS SIMULATION AND CONTROL USING ASPEN
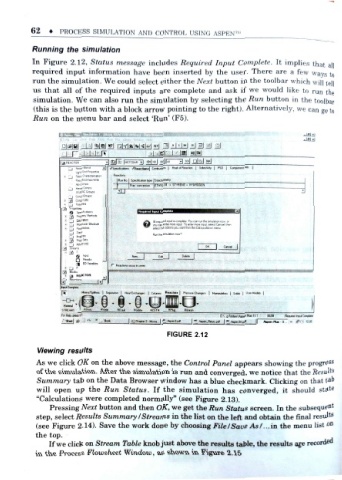
Running the simulation
In Figure 2.12 , Status message includes Required Input Complete. It implies that
all
required input information have been inserted by the user. There are a few wa ys to
run the simulation. We could select either the Next button in the toolbar which will t ell
us that all of the required inputs are complete and ask if we would like to run th e
simulation. We can also run the simulation by selecting the Run button in the toolba r
(this is the button with a block arrow pointing to the right). Alternatively, we can go to
Run on the menu bar and select 'Run' (F5).
MM.|8W«'!i ,l|Hllir
DMll
I M ill
Elfb Imeicbah
" "
A«s8V.'Bend /Sp«£tfeahont /Re- , 1 Contujlion | HMHiResclion | Setacli«ly | PSO | EowmrtAm |
Rcadicxs
RxnNo Specilicaiun type Stochiotneby
IttrCanpi ETHYL-01 > STYREHE . KrtiflOGEN
<l 1
UNIFAC Group* -
I Comp-GroLps
Con-.p-Lis's
'
* 1 1 Cperty Methods
S tstrfi tficn At tequfed npd u ocmpHe Y j can rui the MnuMlon nitw. w
': Jj Moiecua- Sbuctm iiu can erttr moe input To er4er more f-pj. Bated Cared th«n
r
> p ParameJers seled t e ooUont yoj mM tnyn Ihe Dais poldOAT-, menu
D a
Rui ir-e sirxilatiwi now?
S Advanced
&reanS
_
- Jfl :
(1 EOVsraH« P Rwchom occu r ien«
CJ P
3 Bocks
. RECTOR
Inpu C«nplete
[H " Mnwii/SpWer; Hea<Ev.-. i9Pt; J .,, Rucloi Chsnga, | M<n>M>t ( 5c«> j U»Mo*b |
- CH
STREAMS ' RStdc RYieW
F - ,r H«o , press F1
Stall * Boot _ Aww.RaocDdr | « Awr.Mcd I
' -
.
FIGURE 2.12
Viewing results
As we click OK on the above message , the Control Panel appears showing the progress
we notice that the Results
of the simulation. After the simulation is run and converged ,
Summary tab on the Data Browser window has a blue checkmark Clicking on that tab
.
it should state
will open up the Run Status. If the simulation has converged ,
"
Calculations were completed normally" (see Figure 2.13).
Pressing Next button and then OK, we get the Run Status screen . In the subsequent
f
step, select Results Summary/Streams in the list on the let and obtain the final results
(see Figure 2.14). Save the work done by choosing File/Save As/...in the menu list on
the top.
Ifwe click on Stream Table knob just above the results table, the results are recorded
in the Process Flowsheet Window, as shown in Figure 2.15