
Page 85 - Process simulation and control using Aspen
P. 85
ASPEN PLUS SIMULATION OF REACTOR MODELS 77
mam
.. ._ - -J »«. Pte Un* OMn m,
QMIHI -I .1 gJ al-i-|«>l*l<l*-| n.| | M
I r l-'l-'l-JV l .lalr : I: Ml
.
"
3
ANIUNE . 3 HYDROGEN -i CYaO-Cl
f LMMMo twite
t
s csm
3
ll ; US
- a -i
*
Kdlarai."
stream
farHsfe.pnMn
| igiM afc. .| gdifcT,«fi .. | g a»»ita 11 .aote. || S fSTI- « 45.} , «.s
C
r
FIGURE 2.33
f
: Ffc Dm Taoai Run Lfesry Wirdiw KHp
DMB| al M -H x?! nklaKI I I »>| IS -I H g|-|3| @|;
"
J J 1 1- i,JV -Hal
,
iLWjilSla)
-
5
@ CSTPJ
oxputatich carsB rsi
Bi«ck.- csra uc tai. rcstr
fV . j Sep«a(«> i HwlE-changer. [ Cokm* Hb«1o« | Pte eChsr rt | M npuWw: | StJd; 1 UiwModel: |
MitoJ
SIflEAMS RStM fffxM REquJ RCiibOi BC5TR B Jg ftSalch
fo K o .. . .-
FIGURE 2.34
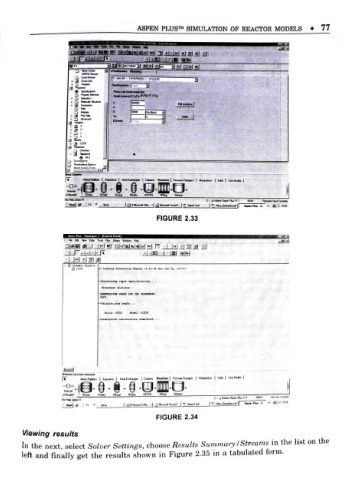
Viewing results
In the next select Solver Settings, choose figsuto Summary/Sf ms in the list on the
,
left and finally get the results shown in Figure 2.35 in a tabulated form.