
Page 86 - Radiochemistry and nuclear chemistry
P. 86
Unstable Nuclei and Radioactive Decay 75
ELECTRON ENERGY, MeV
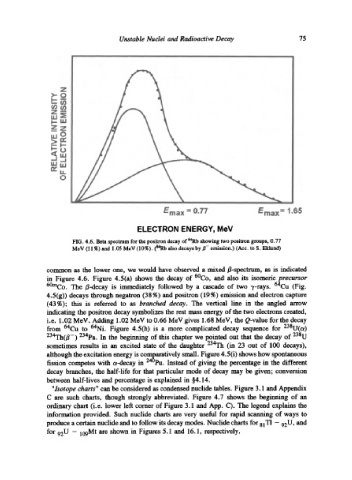
FIG. 4.6. Beta spectrum for the positron decay of S4Rb showing two positron groups, 0.77
MeV (11%) and 1.05 MeV (10%). (S4Rb also decays by/3- emission.) (Acc. to S. Eldund)
common as the lower one, we would have observed a mixed B-spectrum, as is indicated
in Figure 4.6. Figure 4.5(a) shows the decay of 6~ and also its isomeric ~recursor
60mCO. The B-decay is immediately followed by a cascade of two 7-rays. 6"Cu (Fig.
4.5(g)) decays through negatron (38 %) and positron (19%) emission and electron capture
(43%); this is referred to as branched decay. The vertical line in the angled arrow
indicating the positron decay symbolizes the rest mass energy of the two electrons created,
i.e. 1.02 MeV. Adding 1.02 MeV to 0.66 MeV gives 1.68 MeV, the Q-value for the decay
from 64Cu to 64Ni. Figure 4.5(h) is a more complicated decay sequence for 238U(tx)
234Th(B-) 234pa. In the beginning of this chapter we pointed out that the decay of 238U
sometimes results in an excited state of the daughter 234Th (in 23 out of 100 decays),
although the excitation energy is comparatively small. Figure 4.50) shows how spontaneous
fission competes with a-decay in 24~ Instead of giving the percentage in the different
decay branches, the half-life for that particular mode of decay may be given; conversion
between half-lives and percentage is explained in w
"Isotope charts" can be considered as condensed nuclide tables. Figure 3.1 and Appendix
C are such charts, though strongly abbreviated. Figure 4.7 shows the beginning of an
ordinary chart (i.e. lower left comer of Figure 3.1 and App. C). The legend explains the
information provided. Such nuclide charts are very useful for rapid scanning of ways to
produce a certain nuclide and to follow its decay modes. Nuclide charts for 81T1 - 92 U, and
for 92 U - 109Mt are shown in Figures 5.1 and 16.1, respectively.