
Page 293 - Refining Biomass Residues for Sustainable Energy and Bioproducts
P. 293
Effective utilization of sugarcane trash for energy production 261
emphasized that leaving the trash in the field create changes in the soil conditions
causing difficulties in the implementation of cultural practices. Different technolo-
gies were employed for the processing of biomass, that is, thermochemical, chemi-
cal, and biochemical strategies. Solid fuels produced from the agriculture residues
are more potent due to its high volatile content, lower density, and burning time.
12.2 Sugarcane waste as source of biorefineries
Sugarcane as a major feedstock for biorefineries because of its composition and it
is having potential to supply variety of compounds (Table 12.1). The average mass
composition of sugarcane constitutes about cellulose (42%), hemicellulose (34%),
and lignin (13%). The integration of sugarcane crops and biorefinery technologies
offer the development of sustainable biomaterials will lead to novel industrial para-
digm. This involves the use of bioprocessing strategies that convert the biomass
into wide range of products. The main focus of this chapter is to assess the potential
of sugarcane wastes in the biorefinery for creating the possibility of manufacture of
biofuels, value-added chemicals, power, and heat.
Bioprocessing industries releases large amount of by-products that play a signifi-
cant role in energy production, pharmaceutics, and chemicals (Moraes et al., 2015).
Sugarcane is one of the most abundantly used biomass used for the energy produc-
tion since earlier times. About one-third of energy was obtained from the sugarcane
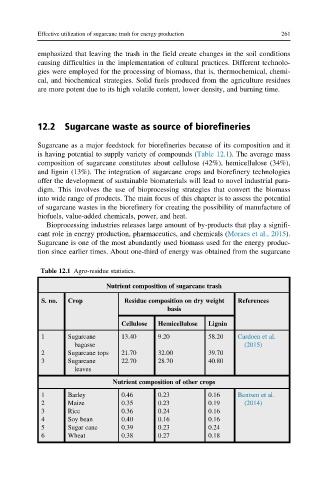
Table 12.1 Agro-residue statistics.
Nutrient composition of sugarcane trash
S. no. Crop Residue composition on dry weight References
basis
Cellulose Hemicellulose Lignin
1 Sugarcane 13.40 9.20 58.20 Cardoen et al.
bagasse (2015)
2 Sugarcane tops 21.70 32.00 39.70
3 Sugarcane 22.70 28.70 40.80
leaves
Nutrient composition of other crops
1 Barley 0.46 0.23 0.16 Bentsen et al.
2 Maize 0.35 0.23 0.19 (2014)
3 Rice 0.36 0.24 0.16
4 Soy bean 0.40 0.16 0.16
5 Sugar cane 0.39 0.23 0.24
6 Wheat 0.38 0.27 0.18