
Page 341 - Refining Biomass Residues for Sustainable Energy and Bioproducts
P. 341
310 Refining Biomass Residues for Sustainable Energy and Bioproducts
(A) 20/40
260 80/150
–300
240
Ozone consumption (mg/g) 200
220
180
160
140
120
100
80
20 25 30 35 40 45 50 55 60 65 70 75 80 85
Moisture (%)
(B)
20/40
260 80/150
–300
240
Ozone consumption (mg/g) 200
220
180
160
140
120
100
80
0.70 0.71 0.72 0.73 0.74 0.75 0.76 0.77 0.78 0.79 0.80
Aw
(C)
100
20/40
90 80/150
–300
80
Glucose yield (%) 70
60
50
40
30
20
10
0
0 10 20 30 40 50 60 70 80 90 100
Delignification rate (%)
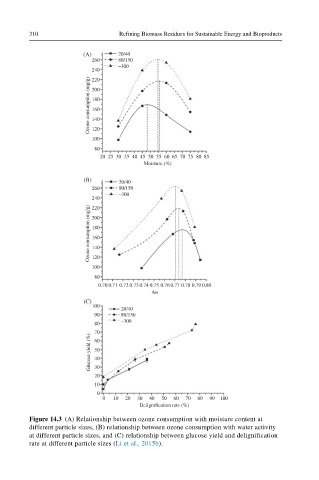
Figure 14.3 (A) Relationship between ozone consumption with moisture content at
different particle sizes, (B) relationship between ozone consumption with water activity
at different particle sizes, and (C) relationship between glucose yield and delignification
rate at different particle sizes (Li et al., 2015b).