
Page 151 - Reliability and Maintainability of In service Pipelines
P. 151
Case Studies on the Application of Structural Reliability 137
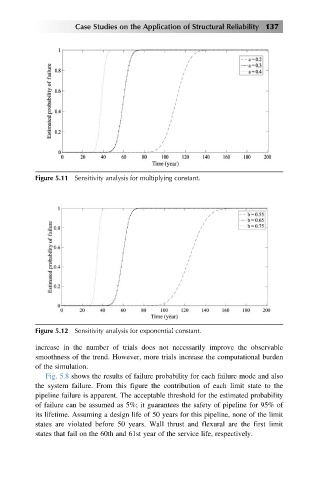
Figure 5.11 Sensitivity analysis for multiplying constant.
Figure 5.12 Sensitivity analysis for exponential constant.
increase in the number of trials does not necessarily improve the observable
smoothness of the trend. However, more trials increase the computational burden
of the simulation.
Fig. 5.8 shows the results of failure probability for each failure mode and also
the system failure. From this figure the contribution of each limit state to the
pipeline failure is apparent. The acceptable threshold for the estimated probability
of failure can be assumed as 5%; it guarantees the safety of pipeline for 95% of
its lifetime. Assuming a design life of 50 years for this pipeline, none of the limit
states are violated before 50 years. Wall thrust and flexural are the first limit
states that fail on the 60th and 61st year of the service life, respectively.