
Page 149 - Reliability and Maintainability of In service Pipelines
P. 149
Case Studies on the Application of Structural Reliability 135
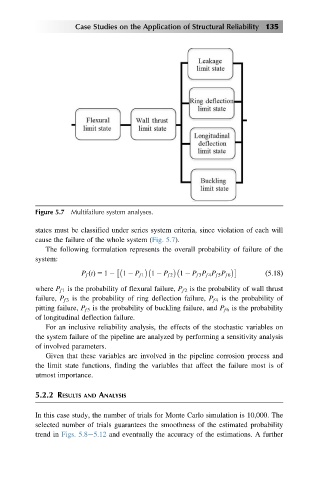
Figure 5.7 Multifailure system analyses.
states must be classified under series system criteria, since violation of each will
cause the failure of the whole system (Fig. 5.7).
The following formulation represents the overall probability of failure of the
system:
P f tðÞ 5 1 2 1 2 P f1 1 2 P f2 1 2 P f3 P f4 P f5 P f6 ð5:18Þ
where P f1 is the probability of flexural failure, P f2 is the probability of wall thrust
failure, P f3 is the probability of ring deflection failure, P f4 is the probability of
pitting failure, P f5 is the probability of buckling failure, and P f6 is the probability
of longitudinal deflection failure.
For an inclusive reliability analysis, the effects of the stochastic variables on
the system failure of the pipeline are analyzed by performing a sensitivity analysis
of involved parameters.
Given that these variables are involved in the pipeline corrosion process and
the limit state functions, finding the variables that affect the failure most is of
utmost importance.
5.2.2 RESULTS AND ANALYSIS
In this case study, the number of trials for Monte Carlo simulation is 10,000. The
selected number of trials guarantees the smoothness of the estimated probability
trend in Figs. 5.8 5.12 and eventually the accuracy of the estimations. A further