
Page 145 - Reliability and Maintainability of In service Pipelines
P. 145
132 Reliability and Maintainability of In-Service Pipelines
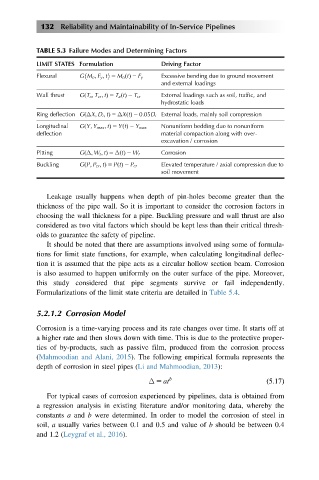
TABLE 5.3 Failure Modes and Determining Factors
LIMIT STATES Formulation Driving Factor
Flexural GM n ; F y ; t 5 M n tðÞ 2 F y Excessive bending due to ground movement
and external loadings
Wall thrust GT a ; T cr ; tð Þ 5 T a tðÞ 2 T cr External loadings such as soil, traffic, and
hydrostatic loads
Ring deflection G ΔX; D i ; tð Þ 5 ΔXtðÞ 2 0:05D i External loads, mainly soil compression
Longitudinal GY; Y max ; tð Þ 5 YtðÞ 2 Y max Nonuniform bedding due to nonuniform
deflection material compaction along with over-
excavation / corrosion
Pitting G Δ; W t ; tÞ 5 Δ t ðÞ 2 W t Corrosion
ð
Buckling GP; P cr ; tð Þ 5 PtðÞ 2 P cr Elevated temperature / axial compression due to
soil movement
Leakage usually happens when depth of pin-holes become greater than the
thickness of the pipe wall. So it is important to consider the corrosion factors in
choosing the wall thickness for a pipe. Buckling pressure and wall thrust are also
considered as two vital factors which should be kept less than their critical thresh-
olds to guarantee the safety of pipeline.
It should be noted that there are assumptions involved using some of formula-
tions for limit state functions, for example, when calculating longitudinal deflec-
tion it is assumed that the pipe acts as a circular hollow section beam. Corrosion
is also assumed to happen uniformly on the outer surface of the pipe. Moreover,
this study considered that pipe segments survive or fail independently.
Formularizations of the limit state criteria are detailed in Table 5.4.
5.2.1.2 Corrosion Model
Corrosion is a time-varying process and its rate changes over time. It starts off at
a higher rate and then slows down with time. This is due to the protective proper-
ties of by-products, such as passive film, produced from the corrosion process
(Mahmoodian and Alani, 2015). The following empirical formula represents the
depth of corrosion in steel pipes (Li and Mahmoodian, 2013):
Δ 5 at b ð5:17Þ
For typical cases of corrosion experienced by pipelines, data is obtained from
a regression analysis in existing literature and/or monitoring data, whereby the
constants a and b were determined. In order to model the corrosion of steel in
soil, a usually varies between 0.1 and 0.5 and value of b should be between 0.4
and 1.2 (Leygraf et al., 2016).