
Page 143 - Reliability and Maintainability of In service Pipelines
P. 143
130 Reliability and Maintainability of In-Service Pipelines
1
0.9
0.8
Probability of failure 0.6 Yield Strength = 437 MPa
0.7
0.5
0.4
Yield Strength = 461 MPa
0.3
Yield Strength = 489 MPa
0.2
0.1
0
0 10 20 30 40 50 60
Time (year)
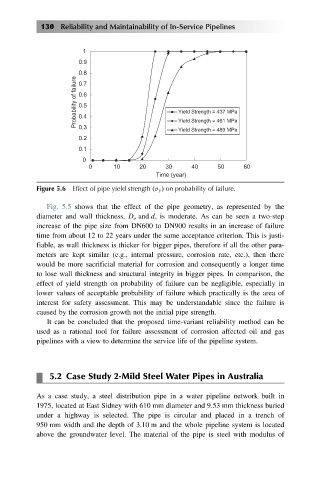
Figure 5.6 Effect of pipe yield strength ðσ y Þ on probability of failure.
Fig. 5.5 shows that the effect of the pipe geometry, as represented by the
diameter and wall thickness, D o and d, is moderate. As can be seen a two-step
increase of the pipe size from DN600 to DN900 results in an increase of failure
time from about 12 to 22 years under the same acceptance criterion. This is justi-
fiable, as wall thickness is thicker for bigger pipes, therefore if all the other para-
meters are kept similar (e.g., internal pressure, corrosion rate, etc.), then there
would be more sacrificial material for corrosion and consequently a longer time
to lose wall thickness and structural integrity in bigger pipes. In comparison, the
effect of yield strength on probability of failure can be negligible, especially in
lower values of acceptable probability of failure which practically is the area of
interest for safety assessment. This may be understandable since the failure is
caused by the corrosion growth not the initial pipe strength.
It can be concluded that the proposed time-variant reliability method can be
used as a rational tool for failure assessment of corrosion affected oil and gas
pipelines with a view to determine the service life of the pipeline system.
5.2 Case Study 2-Mild Steel Water Pipes in Australia
As a case study, a steel distribution pipe in a water pipeline network built in
1975, located at East Sidney with 610 mm diameter and 9.53 mm thickness buried
under a highway is selected. The pipe is circular and placed in a trench of
950 mm width and the depth of 3:10 m and the whole pipeline system is located
above the groundwater level. The material of the pipe is steel with modulus of