
Page 142 - Reliability and Maintainability of In service Pipelines
P. 142
Case Studies on the Application of Structural Reliability 129
1
0.9
0.8
Probability of failure 0.6 c d = 0.2, c l = 10 mm/year
0.7
0.5
0.4
c = 0.1, c = 5 mm/year
0.3
d
l
c = 0.05, c = 2.5 mm/year
0.2 d l
0.1
0
0 25 50 75 100 125 150
Time (year)
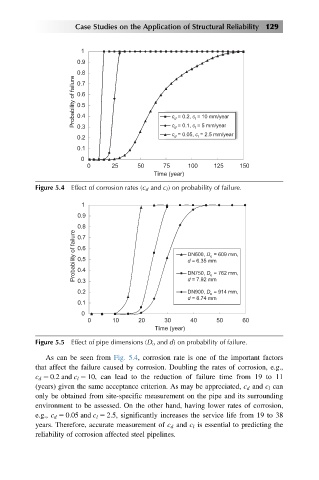
Figure 5.4 Effect of corrosion rates (c d and c l ) on probability of failure.
1
0.9
0.8
Probability of failure 0.6 DN600, D = 609 mm,
0.7
o
0.5
d = 6.35 mm
0.4
DN750, D = 762 mm,
o
0.3
DN900, D = 914 mm,
0.2 d = 7.92 mm
o
d = 8.74 mm
0.1
0
0 10 20 30 40 50 60
Time (year)
Figure 5.5 Effect of pipe dimensions (D o and d) on probability of failure.
As can be seen from Fig. 5.4, corrosion rate is one of the important factors
that affect the failure caused by corrosion. Doubling the rates of corrosion, e.g.,
c d 5 0:2 and c l 5 10, can lead to the reduction of failure time from 19 to 11
(years) given the same acceptance criterion. As may be appreciated, c d and c l can
only be obtained from site-specific measurement on the pipe and its surrounding
environment to be assessed. On the other hand, having lower rates of corrosion,
e.g., c d 5 0:05 and c l 5 2:5; significantly increases the service life from 19 to 38
years. Therefore, accurate measurement of c d and c l is essential to predicting the
reliability of corrosion affected steel pipelines.