
Page 140 - Reliability and Maintainability of In service Pipelines
P. 140
Case Studies on the Application of Structural Reliability 127
assumption of no correlation may not lead to significant difference. On the other
hand, the theory of stochastic processes (Papoulis and Pillai, 2002) and the
research experience (Li and Mahmoodian, 2013) suggest that the assumption of
no autocorrelation between different time points generally leads to greater esti-
mates of the probability of the occurrence of events, which is conservative for the
assessment of pipeline deterioration.
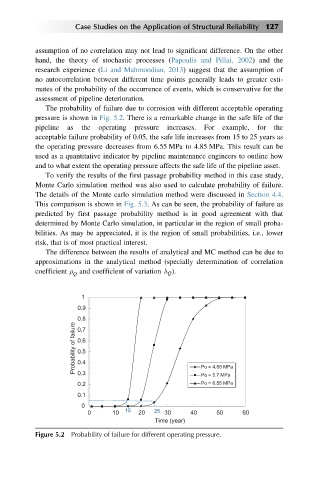
The probability of failure due to corrosion with different acceptable operating
pressure is shown in Fig. 5.2. There is a remarkable change in the safe life of the
pipeline as the operating pressure increases. For example, for the
acceptable failure probability of 0.05, the safe life increases from 15 to 25 years as
the operating pressure decreases from 6.55 MPa to 4.85 MPa. This result can be
used as a quantitative indicator by pipeline maintenance engineers to outline how
and to what extent the operating pressure affects the safe life of the pipeline asset.
To verify the results of the first passage probability method in this case study,
Monte Carlo simulation method was also used to calculate probability of failure.
The details of the Monte carlo simulation method were discussed in Section 4.4.
This comparison is shown in Fig. 5.3. As can be seen, the probability of failure as
predicted by first passage probability method is in good agreement with that
determined by Monte Carlo simulation, in particular in the region of small proba-
bilities. As may be appreciated, it is the region of small probabilities, i.e., lower
risk, that is of most practical interest.
The difference between the results of analytical and MC method can be due to
approximations in the analytical method (specially determination of correlation
coefficient ρ and coefficient of variation λ Q ).
Q
1
0.9
0.8
Probability of failure 0.6
0.7
0.5
0.4
0.3
Po = 5.7 MPa
Po = 6.55 MPa
0.2 Po = 4.85 MPa
0.1
0
0 10 15 20 25 30 40 50 60
Time (year)
Figure 5.2 Probability of failure for different operating pressure.