
Page 135 - Reliability and Maintainability of In service Pipelines
P. 135
122 Reliability and Maintainability of In-Service Pipelines
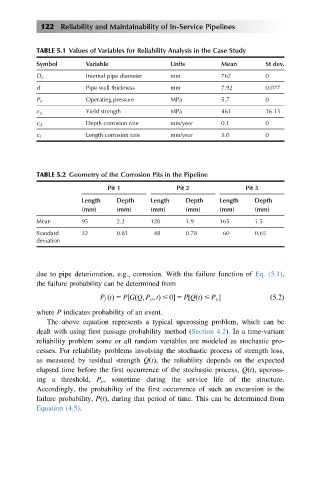
TABLE 5.1 Values of Variables for Reliability Analysis in the Case Study
Symbol Variable Units Mean St dev.
D o Internal pipe diameter mm 762 0
d Pipe wall thickness mm 7.92 0.077
P o Operating pressure MPa 5.7 0
σ y Yield strength MPa 461 16.13
c d Depth corrosion rate mm/year 0.1 0
c l Length corrosion rate mm/year 5.0 0
TABLE 5.2 Geometry of the Corrosion Pits in the Pipeline
Pit 1 Pit 2 Pit 3
Length Depth Length Depth Length Depth
(mm) (mm) (mm) (mm) (mm) (mm)
Mean 95 2.2 120 1.9 165 1.5
Standard 32 0.81 48 0.78 60 0.65
deviation
due to pipe deterioration, e.g., corrosion. With the failure function of Eq. (5.1),
the failure probability can be determined from
P f tðÞ 5 PG Q; P o ; tð Þ # 0 5 PQðtÞ # P o ð5:2Þ
½
½
where P indicates probability of an event.
The above equation represents a typical upcrossing problem, which can be
dealt with using first passage probability method (Section 4.2). In a time-variant
reliability problem some or all random variables are modeled as stochastic pro-
cesses. For reliability problems involving the stochastic process of strength loss,
as measured by residual strength QðtÞ, the reliability depends on the expected
elapsed time before the first occurrence of the stochastic process, QðtÞ, upcross-
ing a threshold, P o , sometime during the service life of the structure.
Accordingly, the probability of the first occurrence of such an excursion is the
failure probability, PðtÞ, during that period of time. This can be determined from
Equation (4.5).