
Page 51 -
P. 51
36 CHAPTER 2 Experimental research
All of the above responses are well grounded, though the last two responses have
deeper statistical roots. The claim that females are taller than males is wrong due to
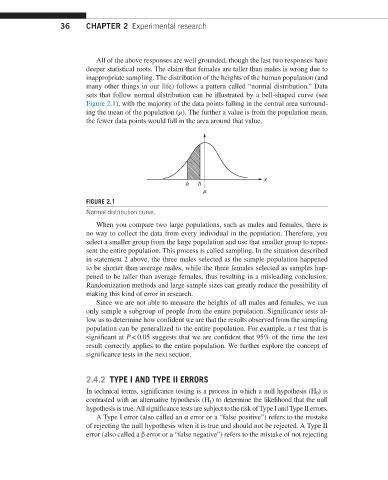
inappropriate sampling. The distribution of the heights of the human population (and
many other things in our life) follows a pattern called “normal distribution.” Data
sets that follow normal distribution can be illustrated by a bell-shaped curve (see
Figure 2.1), with the majority of the data points falling in the central area surround-
ing the mean of the population (μ). The further a value is from the population mean,
the fewer data points would fall in the area around that value.
x
a b
m
FIGURE 2.1
Normal distribution curve.
When you compare two large populations, such as males and females, there is
no way to collect the data from every individual in the population. Therefore, you
select a smaller group from the large population and use that smaller group to repre-
sent the entire population. This process is called sampling. In the situation described
in statement 2 above, the three males selected as the sample population happened
to be shorter than average males, while the three females selected as samples hap-
pened to be taller than average females, thus resulting in a misleading conclusion.
Randomization methods and large sample sizes can greatly reduce the possibility of
making this kind of error in research.
Since we are not able to measure the heights of all males and females, we can
only sample a subgroup of people from the entire population. Significance tests al-
low us to determine how confident we are that the results observed from the sampling
population can be generalized to the entire population. For example, a t test that is
significant at P < 0.05 suggests that we are confident that 95% of the time the test
result correctly applies to the entire population. We further explore the concept of
significance tests in the next section.
2.4.2 TYPE I AND TYPE II ERRORS
In technical terms, significance testing is a process in which a null hypothesis (H 0 ) is
contrasted with an alternative hypothesis (H 1 ) to determine the likelihood that the null
hypothesis is true. All significance tests are subject to the risk of Type I and Type II errors.
A Type I error (also called an α error or a “false positive”) refers to the mistake
of rejecting the null hypothesis when it is true and should not be rejected. A Type II
error (also called a β error or a “false negative”) refers to the mistake of not rejecting