
Page 184 - Reservoir Formation Damage
P. 184
166 Reservoir Formation Damage
(9-3)
where F s < 1 for undersaturated solution, F s = 1 for saturated solution, and
> 1 for supersaturated solution. is the mole fraction of the dissolved
F s X A
organic in oil and (X A) S is the organic solubility at saturation conditions.
is predicted using the thermodynamic model by Chung (1992).
(X A) S
Crystallization
Majors (1999) explains that "Crystallization is the arrangement of
atoms from a solution into an orderly solid phase." and "Growth is simply
the deposition of material at growth sites on an existing crystal face."
The process is called primary nucleation if there are no crystals present
in the solution to start with and crystallization is occurring for the first
time. Primary nucleation can be homogeneous or heterogeneous (Majors,
1999). Homogeneous nucleation occurs inside the solution without contact
with any surface. Heterogeneous nucleation occurs over a solid surface.
The process is called secondary nucleation if there are already some
crystals present in the system over which further deposition can occur.
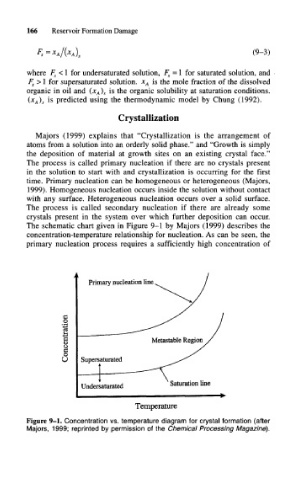
The schematic chart given in Figure 9-1 by Majors (1999) describes the
concentration-temperature relationship for nucleation. As can be seen, the
primary nucleation process requires a sufficiently high concentration of
c
1
§
o
B
u
Undersaturated Saturation line
Temperature
Figure 9-1. Concentration vs. temperature diagram for crystal formation (after
Majors, 1999; reprinted by permission of the Chemical Processing Magazine).