
Page 241 - Reservoir Formation Damage
P. 241
Single-Phase Formation Damage by Fines Migration and Clay Swelling 221
(10-173)
i=2
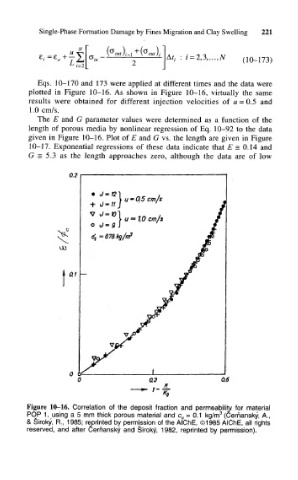
Eqs. 10-170 and 173 were applied at different times and the data were
plotted in Figure 10-16. As shown in Figure 10-16, virtually the same
results were obtained for different injection velocities of u = 0.5 and
1.0 cm/s.
The E and G parameter values were determined as a function of the
length of porous media by nonlinear regression of Eq. 10-92 to the data
given in Figure 10-16. Plot of E and G vs. the length are given in Figure
10-17. Exponential regressions of these data indicate that E = 0.14 and
G = 5.3 as the length approaches zero, although the data are of low
0.2
• J **n\ ne ,
\ u" 0.5 cm/s
+ J
} u=*1,0 cm/s
V J
o J
878 kg/irf
0.1
Figure 10-16. Correlation of the deposit fraction and permeability for material
3
POP 1, using a 5 mm thick porous material and c 0 = 0.1 kg/m (Cerhansky, A.,
& Siroky, R., 1985; reprinted by permission of the AlChE, ©1985 AlChE, all rights
reserved, and after Cerhansky and Siroky, 1982, reprinted by permission).