
Page 238 - Reservoir Formation Damage
P. 238
218 Reservoir Formation Damage
(text continued from page 215)
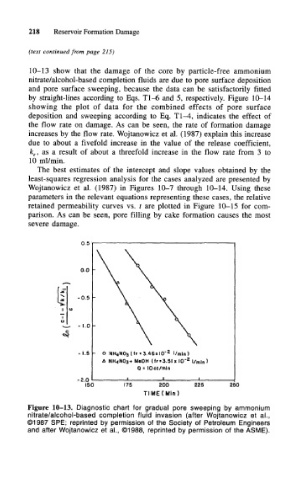
10-13 show that the damage of the core by particle-free ammonium
nitrate/alcohol-based completion fluids are due to pore surface deposition
and pore surface sweeping, because the data can be satisfactorily fitted
by straight-lines according to Eqs. Tl-6 and 5, respectively. Figure 10-14
showing the plot of data for the combined effects of pore surface
deposition and sweeping according to Eq. Tl-4, indicates the effect of
the flow rate on damage. As can be seen, the rate of formation damage
increases by the flow rate. Wojtanowicz et al. (1987) explain this increase
due to about a fivefold increase in the value of the release coefficient,
k e, as a result of about a threefold increase in the flow rate from 3 to
10 ml/min.
The best estimates of the intercept and slope values obtained by the
least-squares regression analysis for the cases analyzed are presented by
Wojtanowicz et al. (1987) in Figures 10-7 through 10-14. Using these
parameters in the relevant equations representing these cases, the relative
retained permeability curves vs. t are plotted in Figure 10-15 for com-
parison. As can be seen, pore filling by cake formation causes the most
severe damage.
0.5
o.o
-0.5
- 1.0
-1.5 NH 4 N0 3 (frO.46xlO- z l/min)
A NH 4N0 3+ MeOH (fr*3.5l x IO' 2
Q - lOcc/min
-2.0
150 175 200 225 250
T I M E ( M i n )
Figure 10-13. Diagnostic chart for gradual pore sweeping by ammonium
nitrate/alcohol-based completion fluid invasion (after Wojtanowicz et al.,
©1987 SPE; reprinted by permission of the Society of Petroleum Engineers
and after Wojtanowicz et al., ©1988, reprinted by permission of the ASME).