
Page 235 - Reservoir Formation Damage
P. 235
Single-Phase Formation Damage by Fines Migration and Clay Swelling 215
i.o
0.6
O TSS = 405 mg/e
( No Single Pore Blockage)
TSS
(SLOPE* -1. 273x10 '/min )
TSS = 1990 mq/t
(SLOPE* - 1.337 x 10 l/min)
0.2
50 100
TlME(Min)
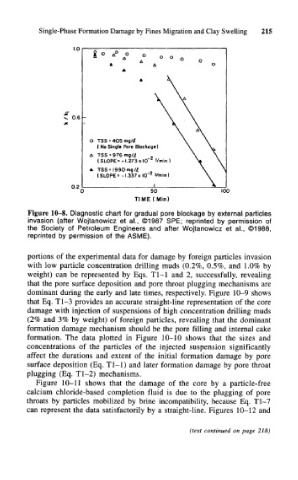
Figure 10-8. Diagnostic chart for gradual pore blockage by external particles
invasion (after Wojtanowicz et al., ©1987 SPE; reprinted by permission of
the Society of Petroleum Engineers and after Wojtanowicz et al., ©1988,
reprinted by permission of the ASME).
portions of the experimental data for damage by foreign particles invasion
with low particle concentration drilling muds (0.2%, 0.5%, and 1.0% by
weight) can be represented by Eqs. Tl-1 and 2, successfully, revealing
that the pore surface deposition and pore throat plugging mechanisms are
dominant during the early and late times, respectively. Figure 10-9 shows
that Eq. Tl-3 provides an accurate straight-line representation of the core
damage with injection of suspensions of high concentration drilling muds
(2% and 3% by weight) of foreign particles, revealing that the dominant
formation damage mechanism should be the pore filling and internal cake
formation. The data plotted in Figure 10-10 shows that the sizes and
concentrations of the particles of the injected suspension significantly
affect the durations and extent of the initial formation damage by pore
surface deposition (Eq. Tl-1) and later formation damage by pore throat
plugging (Eq. Tl-2) mechanisms.
Figure 10-11 shows that the damage of the core by a particle-free
calcium chloride-based completion fluid is due to the plugging of pore
throats by particles mobilized by brine incompatibility, because Eq. Tl-7
can represent the data satisfactorily by a straight-line. Figures 10-12 and
(text continued on page 218)