
Page 234 - Reservoir Formation Damage
P. 234
214 Reservoir Formation Damage
conduct laboratory experiments in a manner to extract useful information.
Here, the analysis of experimental data by means of the mathematical
models developed in this chapter is illustrated by several examples taken
from the literature.
Applications of the Wojtanowicz et al. Model
In general, formation damage may be a result of a number of mechanisms
acting together with different relative contributions. But the Wojtanowicz
et al. (1987, 1988) analysis of experimental data is based on the assump-
tion that one of the potential formation damage mechanisms is dominant
under certain conditions. Therefore, by testing the various diagnostic
equations given in Table 10-1 derived by Wojtanowicz et al. for possible
mechanisms involving the laboratory core damage, the particular govern-
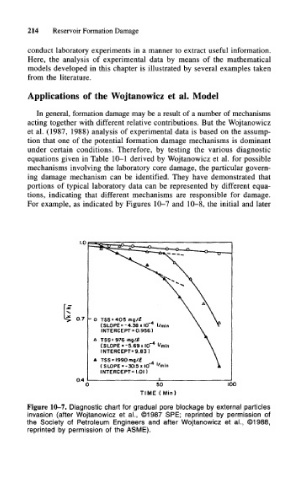
ing damage mechanism can be identified. They have demonstrated that
portions of typical laboratory data can be represented by different equa-
tions, indicating that different mechanisms are responsible for damage.
For example, as indicated by Figures 10-7 and 10-8, the initial and later
- O TSS*405 ma//
(SLOPE =-4.38x10
TSS=976 mq/4
4
(SLOPE'-5.69xlO~ "min
INTERCEPT = 9.83)
TSS*l990mg/£
(SLOPE--30.5x10
INTERCEPT =1.01)
50
TIME ( Min)
Figure 10-7. Diagnostic chart for gradual pore blockage by external particles
invasion (after Wojtanowicz et al., ©1987 SPE; reprinted by permission of
the Society of Petroleum Engineers and after Wojtanowicz et al., ©1988,
reprinted by permission of the ASME).