
Page 58 - Reservoir Geomechanics
P. 58
42 Reservoir geomechanics
2600
2800
3000
Depth (m)
3200
HYDROSTATIC
PORE PRESSURE
GRADIENT
3400
3600
40 42 44 46 48 50 52 54
Pore pressure (MPa)
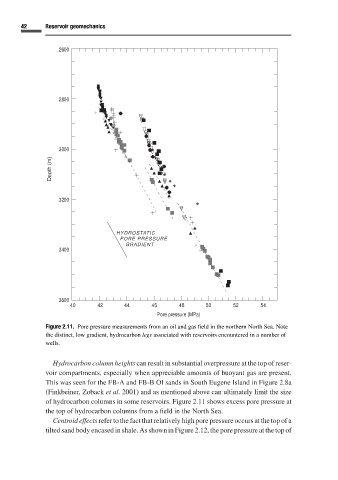
Figure 2.11. Pore pressure measurements from an oil and gas field in the northern North Sea. Note
the distinct, low gradient, hydrocarbon legs associated with reservoirs encountered in a number of
wells.
Hydrocarbon column heights can result in substantial overpressure at the top of reser-
voir compartments, especially when appreciable amounts of buoyant gas are present.
This was seen for the FB-A and FB-B OI sands in South Eugene Island in Figure 2.8a
(Finkbeiner, Zoback et al. 2001) and as mentioned above can ultimately limit the size
of hydrocarbon columns in some reservoirs. Figure 2.11 shows excess pore pressure at
the top of hydrocarbon columns from a field in the North Sea.
Centroid effects refer to the fact that relatively high pore pressure occurs at the top of a
tilted sand body encased in shale. As shown in Figure 2.12, the pore pressure at the top of