Page 93 - Reservoir Geomechanics
P. 93

a.
                                30

                                25
                               Differential stress (MPa)  20


                                15
                                10

                                5
                                             HYDROSTATIC
                                0
                                 0     5     10    15     20    25
                                              Time (hours)

                 b.
                   60
                          Strain rate = 10 −5 /s   Stress relaxation at constant axial strain
                          Strain rate = 10 −6 /s           (e 11  = ~0.7)
                   50     Strain rate = 10 −7 /s
                  Differential stress (MPa)  30  Pc = 50 MPa  Pc = 15 MPa
                   40


                   20

                   10

                   0
                    0     0.016  0.032  0.048  0.064  1     2    3     4    5
                                Axial strain (in/in)        Time (hours)

               c.
                  1.4
                                                   Biot Squirt theory
                     Low-frequency dispersion       (oil saturation)
                  1.2
                                        Gassmann static limit
                  1
                Normalized bulk modulus  0.8  Pressure-cycling data Seismic data  Well-log data  Ultrasonic data


                  0.6

                  0.4
                         Static "modulus"
                  0.2
                  0
                  1.00E−05  1.00E−03  1.00E−01  1.00E+01  1.00E+03  1.00E+05  1.00E+07
                                              Frequency (Hz)

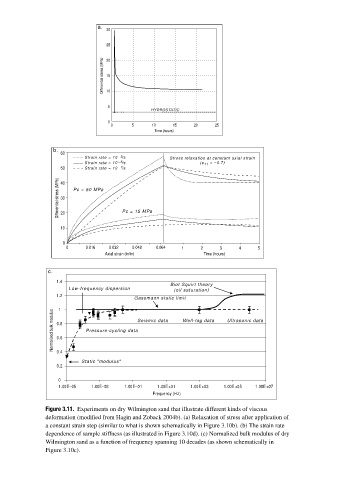
              Figure 3.11. Experiments on dry Wilmington sand that illustrate different kinds of viscous
              deformation (modified from Hagin and Zoback 2004b). (a) Relaxation of stress after application of
              a constant strain step (similar to what is shown schematically in Figure 3.10b). (b) The strain rate
              dependence of sample stiffness (as illustrated in Figure 3.10d). (c) Normalized bulk modulus of dry
              Wilmington sand as a function of frequency spanning 10 decades (as shown schematically in
              Figure 3.10c).
   88   89   90   91   92   93   94   95   96   97   98