
Page 94 - Reservoir Geomechanics
P. 94
78 Reservoir geomechanics
Creep response
Mechanical model Modulus disperson Attenuation response
(at constant stress)
Maxwell solid s/h h = a
Strain s/E 1 Modulus h = b 1/Q h = b
1
E h a>b h = a a>b
1 1 Time Log frequency Log frequency
Voight solid
E s/E h = a
Strain Modulus h = b 1/Q h = b
2 2 h = a
h a>b a>b
2 Log frequency
Time Log frequency
Standard linear s(E E )/(E E )
1 + 1 1 2
solid E h = a
Strain Modulus h = b 1/Q h = b
2 h = a
s/E 1
E a>b a>b
1 h 2 Time Log frequency Log frequency
Burber’s solid
Strain 1 Modulus 1/Q
E 2 s/h
s/E
E h h 1
1 1 Time Log frequency Log frequency
2
Power law
n Strain 1/Q
E(t) = E + Ct Modulus
o
Time Log frequency Log frequency
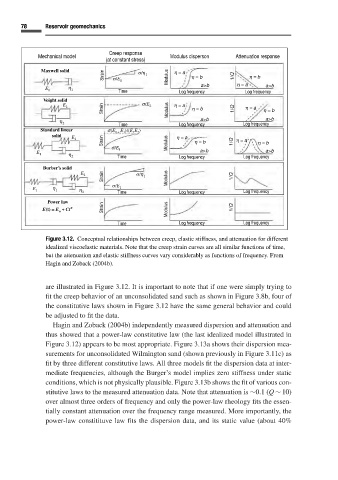
Figure 3.12. Conceptual relationships between creep, elastic stiffness, and attenuation for different
idealized viscoelastic materials. Note that the creep strain curves are all similar functions of time,
but the attenuation and elastic stiffness curves vary considerably as functions of frequency. From
Hagin and Zoback (2004b).
are illustrated in Figure 3.12.Itis important to note that if one were simply trying to
fit the creep behavior of an unconsolidated sand such as shown in Figure 3.8b, four of
the constitutive laws shown in Figure 3.12 have the same general behavior and could
be adjusted to fit the data.
Hagin and Zoback (2004b) independently measured dispersion and attenuation and
thus showed that a power-law constitutive law (the last idealized model illustrated in
Figure 3.12) appears to be most appropriate. Figure 3.13a shows their dispersion mea-
surements for unconsolidated Wilmington sand (shown previously in Figure 3.11c) as
fit by three different constitutive laws. All three models fit the dispersion data at inter-
mediate frequencies, although the Burger’s model implies zero stiffness under static
conditions, which is not physically plausible. Figure 3.13b shows the fit of various con-
stitutive laws to the measured attenuation data. Note that attenuation is ∼0.1 (Q ∼ 10)
over almost three orders of frequency and only the power-law rheology fits the essen-
tially constant attenuation over the frequency range measured. More importantly, the
power-law constitituve law fits the dispersion data, and its static value (about 40%