
Page 103 - Robotics Designing the Mechanisms for Automated Machinery
P. 103
92 Dynamic Analysis of Drives
FIGURE 3.23 Layout of a
pneumatic drive.
R = gas constant,
ft = p/p r = ratio of the pressure in cylinder 3 to that in the receiver,
k = adiabatic exponent (k= 1.41).
At this stage, we must distinguish between supercritical and subcritical regimes. If
we denote p cr as the critical pressure, then
(for airft cr = 0.528) for the supercritical regime p r > p/fi crt and for the subcritical regime,
p r < piP cr, where p = pressure in the cylinder.
To explain the meaning of the concept of the critical regime, let us make use of the
example shown in Figure 3.24. In the left volume a pressure p r, which is much higher
than pressure p, is created and maintained permanently. At some moment of time the
valve is opened and the gas from the left volume begins to flow into the right volume.
Because we stated in the beginning that p < p r, we have a situation where the ratio
p/p r =ft grows theoretically from zero to one (when p becomes equal to p r). The air con-
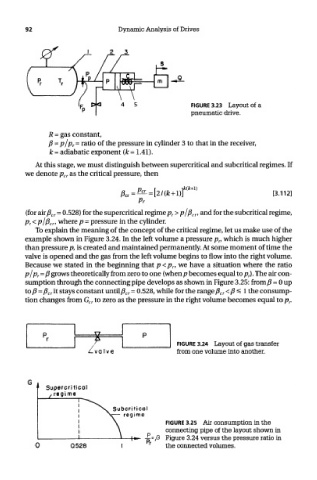
sumption through the connecting pipe develops as shown in Figure 3.25: from/? = 0 up
loft =ft cr it stays constant until ft cr = 0.528, while for the range ft cr <ft =£ 1 the consump-
tion changes from G cr to zero as the pressure in the right volume becomes equal to p r
FIGURE 3.24 Layout of gas transfer
from one volume into another.
FIGURE 3.25 Air consumption in the
connecting pipe of the layout shown in
Figure 3.24 versus the pressure ratio in
the connected volumes.