
Page 70 - Rock Mechanics For Underground Mining
P. 70
ROCK MASS STRUCTURE AND CHARACTERISATION
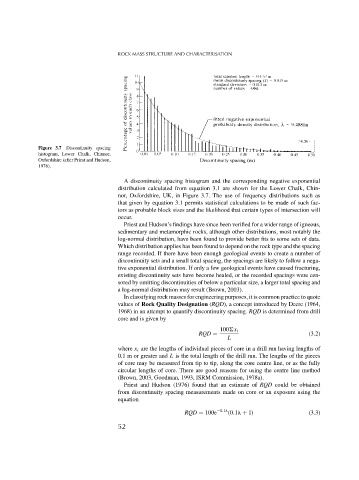
Figure 3.7 Discontinuity spacing
histogram, Lower Chalk, Chinnor,
Oxfordshire (after Priest and Hudson,
1976).
A discontinuity spacing histogram and the corresponding negative exponential
distribution calculated from equation 3.1 are shown for the Lower Chalk, Chin-
nor, Oxfordshire, UK, in Figure 3.7. The use of frequency distributions such as
that given by equation 3.1 permits statistical calculations to be made of such fac-
tors as probable block sizes and the likelihood that certain types of intersection will
occur.
Priest and Hudson’s findings have since been verified for a wider range of igneous,
sedimentary and metamorphic rocks, although other distributions, most notably the
log-normal distribution, have been found to provide better fits to some sets of data.
Which distribution applies has been found to depend on the rock type and the spacing
range recorded. If there have been enough geological events to create a number of
discontinuity sets and a small total spacing, the spacings are likely to follow a nega-
tive exponential distribution. If only a few geological events have caused fracturing,
existing discontinuity sets have become healed, or the recorded spacings were cen-
sored by omitting discontinuities of below a particular size, a larger total spacing and
a log-normal distribution may result (Brown, 2003).
In classifying rock masses for engineering purposes, it is common practice to quote
values of Rock Quality Designation (RQD), a concept introduced by Deere (1964,
1968) in an attempt to quantify discontinuity spacing. RQD is determined from drill
core and is given by
100 x i
RQD = (3.2)
L
where x i are the lengths of individual pieces of core in a drill run having lengths of
0.1 m or greater and L is the total length of the drill run. The lengths of the pieces
of core may be measured from tip to tip, along the core centre line, or as the fully
circular lengths of core. There are good reasons for using the centre line method
(Brown, 2003, Goodman, 1993, ISRM Commission, 1978a).
Priest and Hudson (1976) found that an estimate of RQD could be obtained
from discontinuity spacing measurements made on core or an exposure using the
equation
RQD = 100e −0.1 (0.1 + 1) (3.3)
52