
Page 138 - Safety Risk Management for Medical Devices
P. 138
Risk Analysis Techniques 117
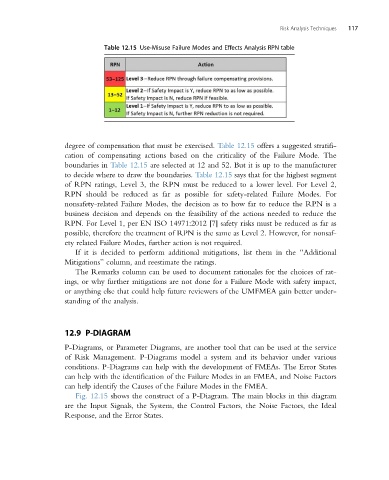
Table 12.15 Use-Misuse Failure Modes and Effects Analysis RPN table
degree of compensation that must be exercised. Table 12.15 offers a suggested stratifi-
cation of compensating actions based on the criticality of the Failure Mode. The
boundaries in Table 12.15 are selected at 12 and 52. But it is up to the manufacturer
to decide where to draw the boundaries. Table 12.15 says that for the highest segment
of RPN ratings, Level 3, the RPN must be reduced to a lower level. For Level 2,
RPN should be reduced as far as possible for safety-related Failure Modes. For
nonsafety-related Failure Modes, the decision as to how far to reduce the RPN is a
business decision and depends on the feasibility of the actions needed to reduce the
RPN. For Level 1, per EN ISO 14971:2012 [7] safety risks must be reduced as far as
possible, therefore the treatment of RPN is the same as Level 2. However, for nonsaf-
ety related Failure Modes, further action is not required.
If it is decided to perform additional mitigations, list them in the “Additional
Mitigations” column, and reestimate the ratings.
The Remarks column can be used to document rationales for the choices of rat-
ings, or why further mitigations are not done for a Failure Mode with safety impact,
or anything else that could help future reviewers of the UMFMEA gain better under-
standing of the analysis.
12.9 P-DIAGRAM
P-Diagrams, or Parameter Diagrams, are another tool that can be used at the service
of Risk Management. P-Diagrams model a system and its behavior under various
conditions. P-Diagrams can help with the development of FMEAs. The Error States
can help with the identification of the Failure Modes in an FMEA, and Noise Factors
can help identify the Causes of the Failure Modes in the FMEA.
Fig. 12.15 shows the construct of a P-Diagram. The main blocks in this diagram
are the Input Signals, the System, the Control Factors, the Noise Factors, the Ideal
Response, and the Error States.