
Page 291 - Satellite Communications, Fourth Edition
P. 291
Analog Signals 271
Noise power spectral density Noise voltage spectral density
f f
(a) (b)
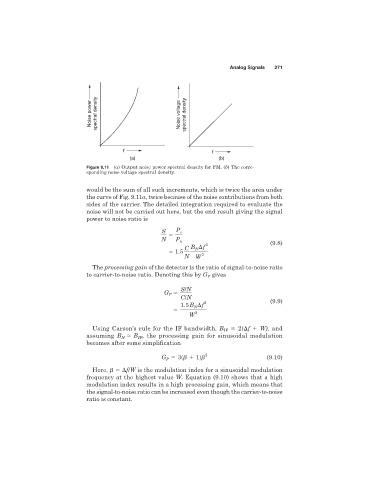
Figure 9.11 (a) Output noise power spectral density for FM. (b) The corre-
sponding noise voltage spectral density.
would be the sum of all such increments, which is twice the area under
the curve of Fig. 9.11a, twice because of the noise contributions from both
sides of the carrier. The detailed integration required to evaluate the
noise will not be carried out here, but the end result giving the signal
power to noise ratio is
S P s
N P n
2 (9.8)
C B f
N
1.5
N W 3
The processing gain of the detector is the ratio of signal-to-noise ratio
to carrier-to-noise ratio. Denoting this by G gives
P
S/N
G
P
C/N (9.9)
1.5 B f 2
N
3
W
Using Carson’s rule for the IF bandwidth, B IF 2( f W), and
assuming B N ≈ B , the processing gain for sinusoidal modulation
IF
becomes after some simplification
G 3s 1d 2 (9.10)
P
Here, f/W is the modulation index for a sinusoidal modulation
frequency at the highest value W. Equation (9.10) shows that a high
modulation index results in a high processing gain, which means that
the signal-to-noise ratio can be increased even though the carrier-to-noise
ratio is constant.