Page 293 - Satellite Communications, Fourth Edition
P. 293

Analog Signals  273


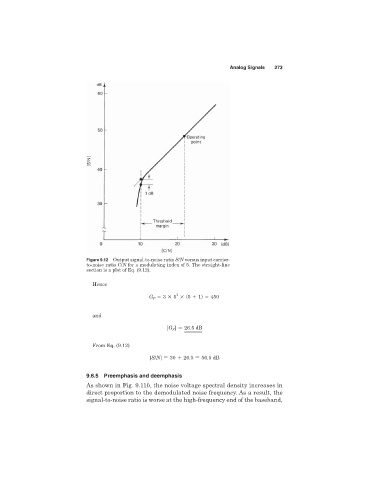
                              Figure 9.12 Output signal-to-noise ratio S/N versus input carrier-
                              to-noise ratio C/N for a modulating index of 5. The straight-line
                              section is a plot of Eq. (9.12).

                                Hence
                                                           2
                                                  G P   3   5   s5   1d   450


                                and
                                                        [G P ]   26.5 dB


                                From Eq. (9.12)
                                                  [S/N]   30   26.5   56.5 dB


                              9.6.5 Preemphasis and deemphasis
                              As shown in Fig. 9.11b, the noise voltage spectral density increases in
                              direct proportion to the demodulated noise frequency. As a result, the
                              signal-to-noise ratio is worse at the high-frequency end of the baseband,
   288   289   290   291   292   293   294   295   296   297   298