
Page 239 - Schaum's Outlines - Probability, Random Variables And Random Processes
P. 239
ANALYSIS AND PROCESSING OF RANDOM PROCESSES [CHAP 6
where a is a real positive constant, is applied to the input of an LTI system with impulse
response
h(t) = e-b'u(t)
where b is a real positive constant. Find the autocorrelation function of the output Y(t) of the
system.
The frequency response H(o) of the system is
The power spectral density of X(t) is
By Eq. (6.63), the power spectral density of Y(t) is
-
- (L)
(a2 - b2)b 02 + a2
Taking the inverse Fourier transform of both sides of the above equation, we obtain
1 (ae-bI~I - be-aIrI)
R~(" = - b2)b
6.27. Verify Eq. (6.25), that is, the power spectral density of any WSS process X(t) is real and S,(o) 2 0.
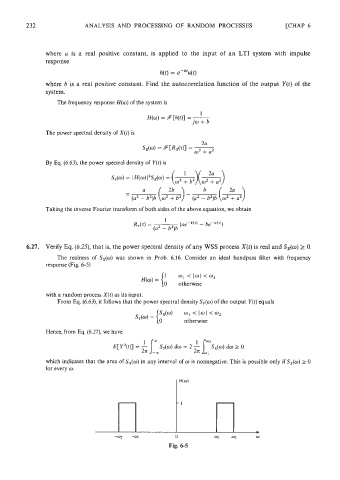
The realness of Sx(o) was shown in Prob. 6.16. Consider an ideal bandpass filter with frequency
response (Fig. 6-5)
1 w,<Iwl<02
H(o) =
0 otherwise
with a random process X(t) as its input.
From Eq. (6.63), it follows that the power spectral density Sy(o) of the output Y(t) equals
I
sy(o) = {y4 a1 < I < a2
otherwise
Hence, from Eq. (6.27), we have
which indicates that the area of Sx(o) in any interval of o is nonnegative. This is possible only if S,(o) 2 0
for every o.
-W2 *I 0 Wl Y W
Fig. 6-5