
Page 251 - Schaum's Outlines - Probability, Random Variables And Random Processes
P. 251
ANALYSIS AND PROCESSING OF RANDOM PROCESSES [CHAP 6
Ans. (a) R,,(t, t + z) = - a2 sin ooz
(b) Sx,(w) - ja2n[6(o .- uO) - 6(0 + coo)]
6.57. Verify Eqs. (6.36) and (6.37).
Hint: Substitute Eq. (6.18) into Eq. (6.34).
6.58. Let Y(t) = X(t) + W(t), where X(t) and W(t) are orthogonal and W(t) is a white noise specified by Eq. (6.43)
or (6.45). Find the autocorrelation function of Y(t).
Ans. Rdt, s) = Rx(t, s) + 026(t - S)
6.59. A zero-mean WSS random process X(t) is called band-limited white noise if its spectral density is given by
Find the autocorrelation function of X(t).
No o, sin o, z
Ans. RX(z) = - -
27~ oBz
6.60. A WSS random process X(t) is applied to the input of an LTI system with impulse response h(t) = 3e-2'u(t).
Find the mean value of Y(t) of the system if E[X(t)] = 2.
Hint: Use Eq. (6.59).
Ans. 3
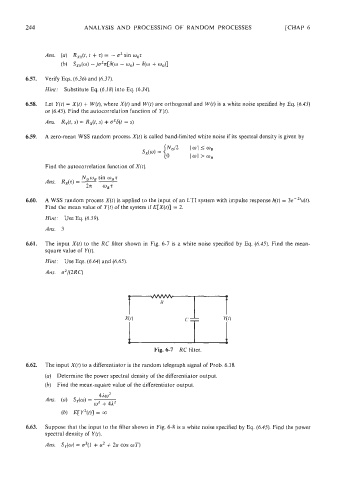
6.61. The input X(t) to the RC filter shown in Fig. 6-7 is a white noise specified by Eq. (6.45). Find the rnean-
square value of Y(t).
Hint: Use Eqs. (6.64) and (6.65).
Ans. 02/(2RC)
Fig. 6-7 RC filter.
6.62. The input X(t) to a differentiator is the random telegraph signal of Prob. 6.18.
(a) Determine the power spectral density of the differentiator output.
(b) Find the mean-square value of the differentiator output.
41m2
Ans. (a) Sy(w) = -
o2 + 4A2
(b) E[Y2(t)J = co
6.63. Suppose that the input to the filter shown in Fig. 6-8 is a white noise specified by Eq. (6.45). Find the power
spectral density of Y(t).
Ans. Sy(o) = a2(1 + a2 + 2a cos oT)