
Page 187 - Theory and Problems of BEGINNING CHEMISTRY
P. 187
176 GASES [CHAP. 12
Table 12-1 are plotted on a graph using P as a vertical axis (y axis) and V as the horizontal axis (x axis). Note
that in plotting a graph based on experimental data, the numerical scales of the axes should be chosen so that the
scales can be read to the same number of significant figures as was used in reporting the measurements. It can
be seen that as the magnitude of the pressure decreases, the magnitude of the volume increases. It is possible to
obtain values of the volume at intermediate values of the pressure merely by reading from points on the curve
(interpolating).
5
4
P (atm) 3
2
1
0
0 2 4 6 8 10 12 14 16 18
V (L)
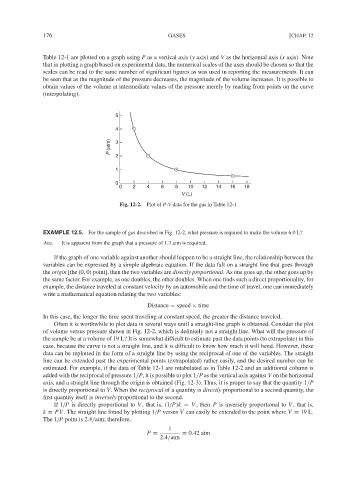
Fig. 12-2. Plot of P-V data for the gas in Table 12-1
EXAMPLE 12.5. For the sample of gas described in Fig. 12-2, what pressure is required to make the volume 6.0 L?
Ans. It is apparent from the graph that a pressure of 1.3 atm is required.
If the graph of one variable against another should happen to be a straight line, the relationship between the
variables can be expressed by a simple algebraic equation. If the data fall on a straight line that goes through
the origin [the (0, 0) point], then the two variables are directly proportional. As one goes up, the other goes up by
the same factor. For example, as one doubles, the other doubles. When one finds such a direct proportionality, for
example, the distance traveled at constant velocity by an automobile and the time of travel, one can immediately
write a mathematical equation relating the two variables:
Distance = speed × time
In this case, the longer the time spent traveling at constant speed, the greater the distance traveled.
Often it is worthwhile to plot data in several ways until a straight-line graph is obtained. Consider the plot
of volume versus pressure shown in Fig. 12-2, which is definitely not a straight line. What will the pressure of
the sample be at a volume of 19 L? It is somewhat difficult to estimate past the data points (to extrapolate) in this
case, because the curve is not a straight line, and it is difficult to know how much it will bend. However, these
data can be replotted in the form of a straight line by using the reciprocal of one of the variables. The straight
line can be extended past the experimental points (extrapolated) rather easily, and the desired number can be
estimated. For example, if the data of Table 12-1 are retabulated as in Table 12-2 and an additional column is
added with the reciprocal of pressure 1/P, it is possible to plot 1/P as the vertical axis against V on the horizontal
axis, and a straight line through the origin is obtained (Fig. 12-3). Thus, it is proper to say that the quantity 1/P
is directly proportional to V. When the reciprocal of a quantity is directly proportional to a second quantity, the
first quantity itself is inversely proportional to the second.
If 1/P is directly proportional to V , that is, (1/P)k = V , then P is inversely proportional to V , that is,
k = PV . The straight line found by plotting 1/P versus V can easily be extended to the point where V = 19 L.
The 1/P point is 2.4/atm; therefore,
1
P = = 0.42 atm
2.4/atm