
Page 189 - Theory and Problems of BEGINNING CHEMISTRY
P. 189
178 GASES [CHAP. 12
Sample 1
Sample 2
V
−273 −100 0 100 200 300 400
t (°C)
0 273 546
T (K)
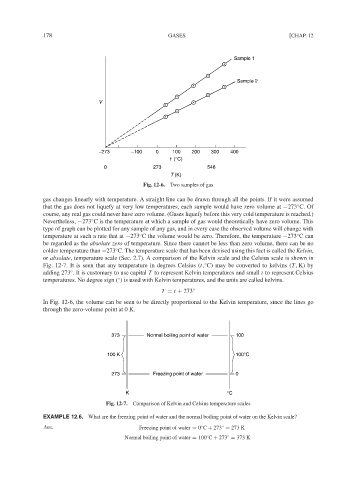
Fig. 12-6. Two samples of gas
gas changes linearly with temperature. A straight line can be drawn through all the points. If it were assumed
◦
that the gas does not liquefy at very low temperatures, each sample would have zero volume at −273 C. Of
course, any real gas could never have zero volume. (Gases liquefy before this very cold temperature is reached.)
◦
Nevertheless, −273 C is the temperature at which a sample of gas would theoretically have zero volume. This
type of graph can be plotted for any sample of any gas, and in every case the observed volume will change with
temperature at such a rate that at −273 C the volume would be zero. Therefore, the temperature −273 C can
◦
◦
be regarded as the absolute zero of temperature. Since there cannot be less than zero volume, there can be no
◦
colder temperature than −273 C. The temperature scale that has been devised using this fact is called the Kelvin,
or absolute, temperature scale (Sec. 2.7). A comparison of the Kelvin scale and the Celsius scale is shown in
Fig. 12-7. It is seen that any temperature in degrees Celsius (t, C) may be converted to kelvins (T, K) by
◦
adding 273 . It is customary to use capital T to represent Kelvin temperatures and small t to represent Celsius
◦
temperatures. No degree sign ( ) is used with Kelvin temperatures, and the units are called kelvins.
◦
T = t + 273 ◦
In Fig. 12-6, the volume can be seen to be directly proportional to the Kelvin temperature, since the lines go
through the zero-volume point at 0 K.
373 Normal boiling point of water 100
100 K 100°C
273 Freezing point of water 0
K °C
Fig. 12-7. Comparison of Kelvin and Celsius temperature scales
EXAMPLE 12.6. What are the freezing point of water and the normal boiling point of water on the Kelvin scale?
Ans. Freezing point of water = 0 C + 273 = 273 K
◦
◦
Normal boiling point of water = 100 C + 273 = 373 K
◦
◦